Biomedical Engineering Reference
In-Depth Information
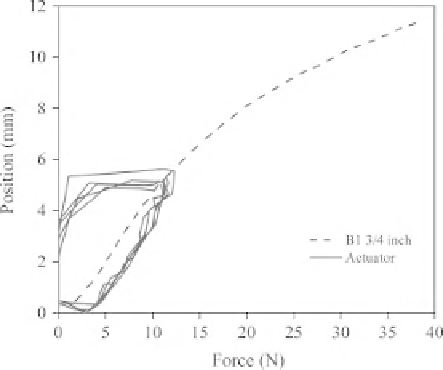
Figure 11.23
The force - position curve of B1 elastomer and its simulated equivalent
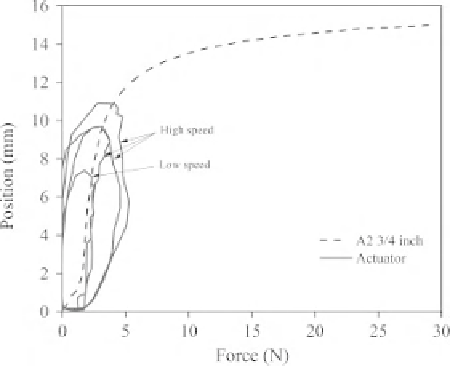
Figure 11.24
The effect of the force rate
Initially, the mechanical properties of the materials were characterized using mechan-
ical compression tests. These data then were saved and used by processing software
for reproducing the same properties in the tactile display. Having the dimension of the
area over which the force was applied, these stress - strain data can be converted to
force - compression which was used by the processing software to actuate the display.
The data were saved in a lookup table in the processing software.