Biomedical Engineering Reference
In-Depth Information
Force
Force
measurement
FSR
LUT
DAQ
input
PID
controller
DAQ
output
Actuator
& driver
Error
Limitter
Shaft position
measurement
Shaft Position
(a)
LUT
Output
Force
measurement
Input
PID
controller
(b)
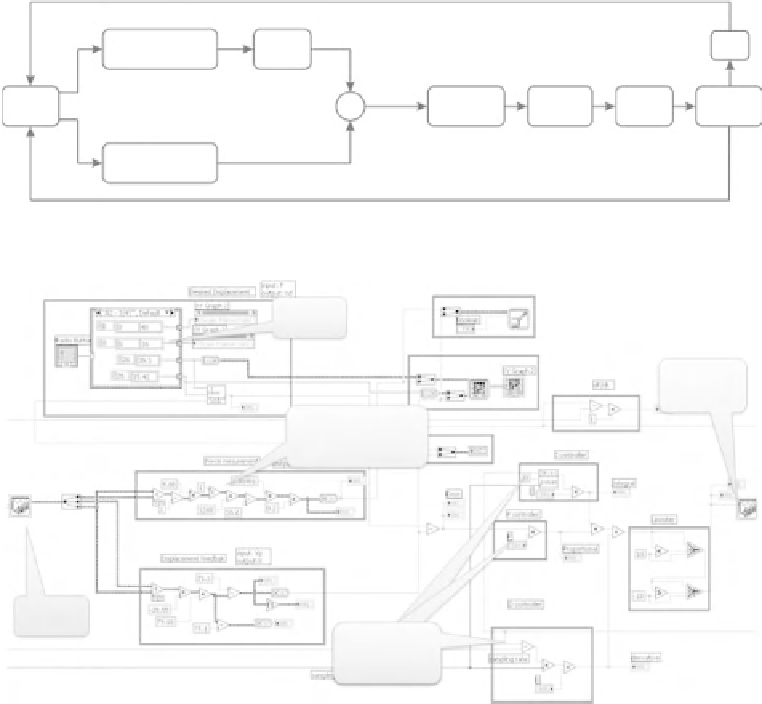
Figure 11.18
(a) The block diagram of the completer system. (b) The block diagram simulated in
the LabVIEW programming environment. LUT: lookup table that contains the force - displacement
data of the target material
The rate of applying the force is also important for the feel of softness. Since the
rate of the force in the original force - deformation data collection was applied slowly, the
error becomes negligible, as depicted in Figure 11.24. However, when the force is applied
suddenly, the error becomes larger. Figure 11.24 shows the real and desired force - position
curves for two different speeds. In the first instance, the force is applied slowly, whereas
in the second case it is applied quickly. From this, it can be seen that the error in the first
case is much less than in the second case. In this study, the force - displacement curve
for the original elastomers was collected only at slow speed. However, in order to obtain
a more comprehensive database on the elastomer, compression tests were conducted at
different force or displacement rates and, based on the user speed at the tactile display
side, the corresponding curve was used.