Biomedical Engineering Reference
In-Depth Information
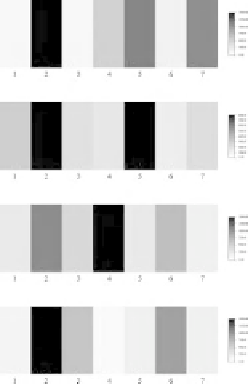
8.3.4 Results and Discussion
The results of the finite element analysis as well as the graphical representations of tactile
information obtained from experimental cases, are shown in Figures 8.22 and 8.23 for
one- and two-dimensional procedures, respectively. Each row in Figure 8.22 shows a
scenario in which multiple lumps with different sizes were inserted into the elastomeric
bulk material. The left column in this figure illustrates the geometrical information about
the locations and size of the lumps that were placed in the soft object. The middle column
in Figure 8.22 is the one-dimensional graphical representation of the sensor's outputs
obtained from the experiments. The right column is the normalized voltage response of
the sensing elements obtained from the finite element analysis.
In the graphical representation in Figure 8.22a (middle column), the dark column 2
has the highest intensity, showing that the lump is located above this sensing element.
This can be compared with the intensity of sensing elements 4 and 5 that share a lump.
For the latter elements, the maximum contact stress value occurs in a place between
sensing elements 4 and 5. Therefore, each sensing element senses part of the load and,
in comparison to sensing element 2, shows lower amplitude. These two elements also
provide information about the size of the lump. If the middle lump was large enough to
cover both sensing elements, the result would be two completely dark bands. Therefore,
from the gray levels shown, the approximate size of the middle lump can be deduced. The
difference observed between the outputs of sensing elements 2 and 7 can be attributed to
the edge effect on the latter element. The second case (Figure 8.22b) shows two identical
lumps embedded above sensing elements 2 and 5. A similar output voltage and intensity
1
(a)
0.5
f
6.3
f
6.3
f
7.0
0
1
(b)
0.5
f
3.9
f
3.9
0
1
0.5
(c)
f
3.9
f3.9
f
6.3
0
1
(d)
0.5
f
6.3
f
3.9
f7.1
0
1234567
Lumps
configurations
Experimental
results
Finite element
results
Figure 8.22
The experimental and analytical results of four case studies