Biomedical Engineering Reference
In-Depth Information
By following the above-mentioned procedures, an image is constructed based on a
matrix of 60
×
100 cells, as shown in Figure 8.9.
8.2.5 Results and Discussion
The results of the conducted experiments are shown as image displays. The softness of
the grasped tissue is represented by color-coding. As shown in Figure 8.10, a scale on
the right-hand side of the graph shows the color coding numerically. In this case, the two
right-hand sensors of the grasper (
U
4
and
L
4
) are engaged. The softness display shows
the sensed object in grayscale. Here, both
U
4
and
L
4
show the same softness.
This means that the grasped object has the same softness throughout its thickness. In
Figure 8.11, the upper and lower jaws are grasping two different materials with different
softness. The material grasped by the upper jaw is softer than the other material. The
result in the softness display is presented by two different grayscales on the upper and
lower part of the display.
In Figure 8.12, the two central sensors of the upper jaw, that is,
U
2
and
U
3
, are in
touch with a soft material and the other sensors on the upper and lower jaws are in touch
40.00
35.00
30.00
25.00
20.00
15.00
10.00
5.00
0.00
(a)
(b)
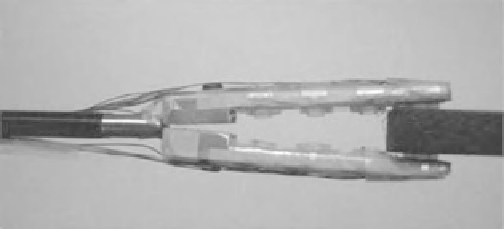
Figure 8.10
The resulting tactile image after interpolation. (b) Photograph of the grasper and the
grasped object