Biomedical Engineering Reference
In-Depth Information
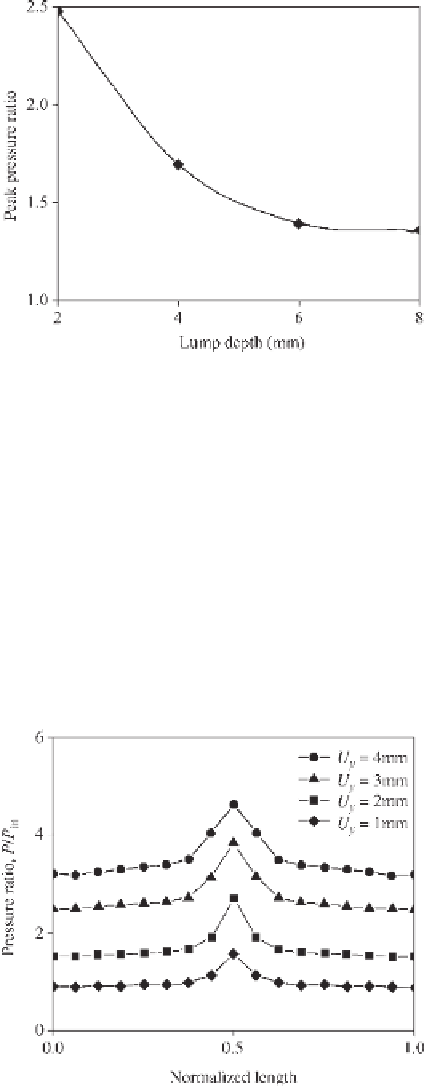
Figure 6.6
Peak pressures for different lump depths when,
R
= 2 mm and the center of the lump
is changed from 2 to 8 mm from the contact surface
6.4.3 The Effect of Applied Load
The magnitude of the applied load also affects the pressure distribution. The results of
the simulations when the applied load was changed from
U
y
=
1 to 4 mm are shown in
Figure 6.7, from which it can be seen that the maximum pressure increases in proportion
to the magnitude of the applied load. This graph also demonstrates that an increase in
applied load does not affect significantly the area under the bell-shaped pressure contour.
However, this dependency shows that for softness sensing or lump detection in addition
to the stress profile, the magnitude of the total applied load must also be measured.
Figure 6.7
The variation of stress profile due to the variations of applied load. The values are
normalized, based on the background pressure for
U
= 1 mm. In these simulations a lump with
radius
R
= 2 mm was located in the middle of the tissue