Biomedical Engineering Reference
In-Depth Information
Table 5.1
The measured softness of five different
materials used in the experiments
Material
Softness
ICF400
7 (Shore OO)
A2
10 (Shore OO)
EVA
45 (Shore OO)
B3
63 (Shore OO)
Silicone rubber-1 (White)
32 (Shore A)
Silicone rubber-2 (Blue)
52 (Shore A)
Silicone rubber-3 (Red)
71 (Shore A)
Silicone rubber-4 (Black)
89 (Shore A)
softness are presented in Table 5.1 . The first four materials (supplied by 3M) were con-
sidered to be very soft. These were tested using a Shore OO durometer, which is suitable
for very soft materials, including soft tissue. The other four materials were different sili-
cone rubbers selected from the standard type A (Shore A) test block kit (ASTM D2240,
Instron Co.).
It should be noted that the materials were sorted from soft to hard (i.e., ICF 400 was the
softest material in this group). The materials were then tested using the equipped grasper
while an FSR sensor was inserted into the grasped object.
In conjunction with the force applied to the object and the dimensions of the force
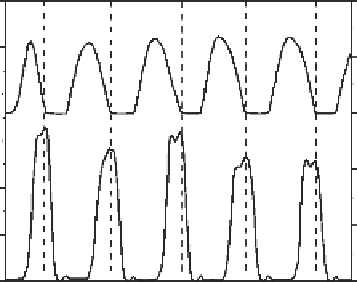
sensor itself, the average pressure was calculated. These parameters, of which a sample
is shown in Figure 5.6, were then plotted in the time domain.
The processing software also calculated and plotted the relationship between the applied
force and the jaw angle. Figure 5.7 shows the force - angle curve for an elastomer.
Two separate phases can be seen in this curve. In the first phase (loading), the open
grasper jaws start closing and eventually apply full pressure to the material. The second
phase (unloading) begins when the jaws start opening. In this phase the applied pressure
is small. Therefore, most of the information on the material properties is gained during
100
50
0
300
200
100
0
Figure 5.6
Samples of the recorded data. The angle of the grasper and registered pressure applied
to the grasped soft object are shown. The pressure is expressed in kPa