Cryptography Reference
In-Depth Information
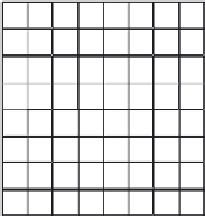
159 177 209 230 222 188 156 156
164 179 203 230 224 198 147 144
158 183 203 228 226 194 143 150
154 179 199 213 217 183 143 151
143 167 193 205 205 153 151 146
127 159 185 200 173 158 149 148
123 134 168 190 172 162 154 145
126 154 190 179 168 159 155 152
(a) Original image
(b) 8×8 DCT amplitude image
(c) A typical 8×8 block (nose tip)
Fig. 2.6.
88 block based DCT transform.
2.2.5 Quantization
Theoretically DCT does not result in any data reduction, as the output of
DCT transform is still 64 coe
cients, and even worse, the DCT coe
cients
have a larger dynamic range (from−255 to 255) than that of the original pixel
values (0 255). However, as the HVS is more sensitive to lower frequencies,
we can design a quantization scheme such that it has finer quantization steps
for the low frequency coe
cients, and a very coarse quantization steps for the
high frequency coe
cients.
Quantization is similar to sub-sampling in that information is discarded.
During quantization, the compression is accomplished by reducing the number
of bits used to describe each coe
cient, rather than reducing the number of
coe
cients. Each coe
cient is reassigned an alternative value and the number
of alternate values is less than that in the original coe
cients.
364 31
-181
-44 19 -12
4
-3
16
11
10
16
24
40
51
61
23
3
-18 -3
1
0
0
0
93
33 -39 23
20 -17
5
-6
12
12
14
19
26
58
60
55
8
3
-3
1
1
0
0
0
-7 -14
7
-1
-9
12
8
-2
14
13
16
24
40
57
69
56
0
-1
0
0
0
0
0
0
0
-17 -6
4
-11
3
12
-9
2
14
17
22
29
51
87
80
62
-1
0
0
0
0
0
0
0
8
5
7
-8
-2
-6
-3
14
18
22
37
56
68 109 103 77
0
0
0
0
0
0
0
0
-3 -11 -1
-11
4
4
1
3
-5
0
0
0
0
0
0
0
0
24
35
55
64
81 104 113 92
6
4
3
-12 -6
-4
0
-3
49
64
78
87 103 121 120 101
0
0
0
0
0
0
0
0
-2
-3
-3
1
7
3
-5
7
72
92
95
98 112 100 103 99
0
0
0
0
0
0
0
0
(a) Original DCT coefficients
F(u,v)
(b) JPEG quantization table
Q
lum
(u,v)
(c) Quantized coefficients
F
q
(u,v)
Fig. 2.7.
Numerical example of quantization process.