Cryptography Reference
In-Depth Information
for 1000 times. Suppose that the probability of a watermarked map is 0.5, we
can calculate the average detection rate of the scheme with certain threshold
T .
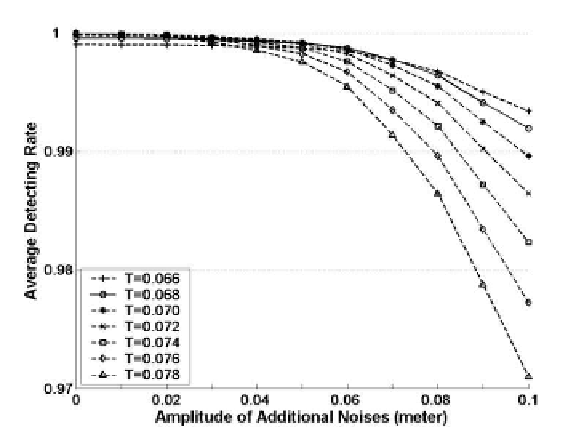
Fig. 6.10.
The average detection rate under noise attacks.
The curves in Figure 6.10 are the average detection rates under noise
attacks with a series of threshold T from 0.066 to 0.078. It is indicated that
the proposed algorithm is robust to the additive noises within the given range
of the amplitude. If the threshold T is decreased from 0.078 to 0.068, the
noise resisting performance could be enhanced simultaneously. T should not
be more small because the detecting rate under lower noise amplitudes could
be significantly decreased, as shown by the curve T =0.066 in Figure 6.10.
The threshold T used in the scheme is 0.068, and the detecting rate is shown
by the solid curve in the figure.
6.2.4 Summary
In this section, the technique of robust vector map watermarking is intro-
duced. A brief review of the typical methods implemented in either the spa-
tial domain or the transform domain is presented. According to the common
weakness of the former works, a shape-preserving scheme is proposed. By
taking into account the local shapes of the map objects, the scheme can ro-
bustly watermark a 2D vector map while introducing low shape-distortions.
Experimental results indicate the performance of the scheme in invisibility
and robustness. The original map used in the experiments is a contour map