Biomedical Engineering Reference
In-Depth Information
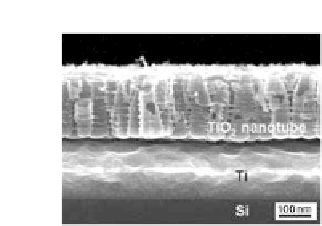
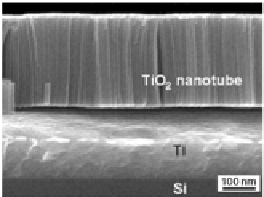
Figure 9.51
SEM images of nanotube/Ti/Si anodized in aqueous solutions
(1 M Na
2
SO
4
+ 0.2 M C
6
H
8
O
7
· H
2
O with the addition of 0.4
wt.% NaF) at 20 V for 600 s (in left) and in glycerol electrolyte
(0.5 wt.% NH
4
F in glycerol) at 10 V for 2 h (in right) [111].
Figure 9.52A presents the thickness of the nanotube as a
function of the anodization time for the aqueous and glycerol
electrolyte. Higher anodizing voltage leads to longer nanotubes for
both electrolytes. Yang
et al
. [111] calculated the conversion ratio
L
/
T
, where
L
is the length of the nanotube and
T
is the thickness
of the consumed titanium (Fig. 9.52B). They found that conversion
ratios of the samples anodized in glycerol electrolyte are more than
1 and those in aqueous electrolyte are nearby 1. The volume
expansion occurs when the titanium metal converts into titanium
oxide. They concluded that a violent etching of nanotube
simultaneously occurred at the interface of electrolyte and
nanotube surface during anodization. The etching made the inal
titanium nanotube short. The anodization in aqueous electrolyte
has a faster growing rate and a larger loss in length of nanotube
than in the glycerol electrolyte due to higher diffusivity of ions.
Figure 9.52
(A) Length of the nanotube as a function of the anodization
time for the aqueous and glycerol electrolyte. (B) Conversion
ratio,
L
/
T
(where
L
is the length of the nanotube grown by
anodization and
T
is the thickness of the consumed titanium)
[111].