Biomedical Engineering Reference
In-Depth Information
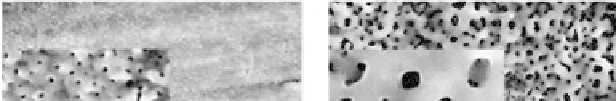
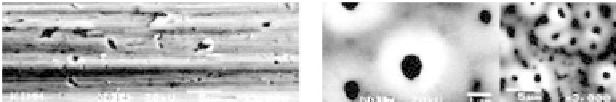
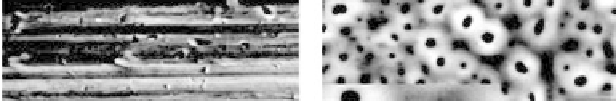
Figure 9.30
SEM images at ×3000 (×10000 in box) show non-porous
structure of the turned screw implants and porous structure
of test S-, P-, and Ca-containing implants [81].
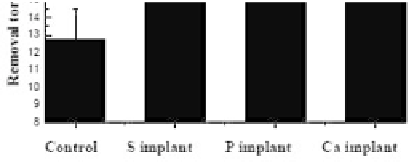
Figure 9.31
Mean removal torque values (N
⋅
cm) after 6 weeks of healing
time, demonstrating statistically signiicant differences
between S implants and controls, and Ca implants and
controls, respectively (*P < 0.005; **P < 0.001) [81].