Biomedical Engineering Reference
In-Depth Information
(a)
(b)
(c)
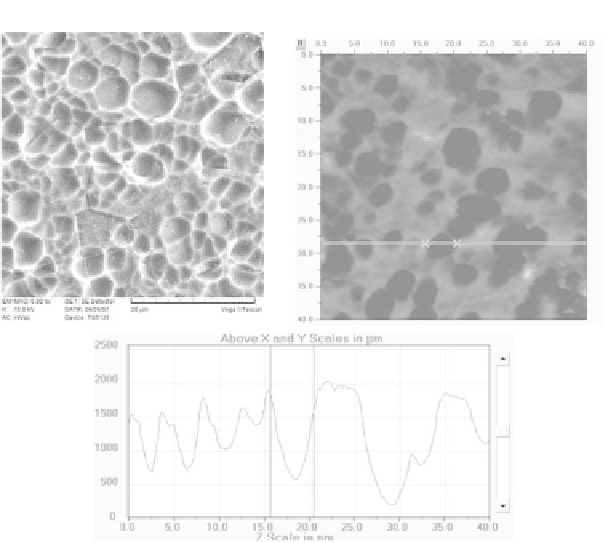
Figure 9.11
SEM (a) and AFM (b) images and cross section (c) of the
titanium surface after etching in 1M H
3
PO
4
+ 10% HF at 10 V
for 5 min [31].
(a)
(b)
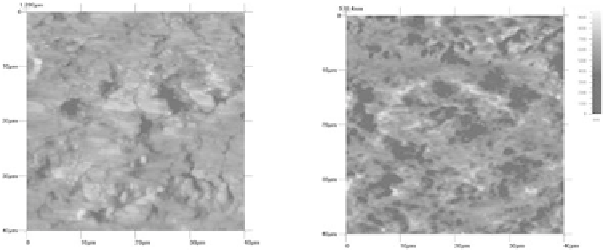
Figure 9.12
Porous TiO
x
formed after etching at 1 V for 60 min in 1M
H
3
PO
4
+ 0.35% HF (a) and 1M H
3
PO
4
+ 2% HF (b) [28].
On Fig. 9.13 is presented variation of the current density
for titanium etched for 5, 15, 30, 60, and 120 min. A signiicant
differences in current density between the start (initial time: 5 s)
and the end (inal time: 5, 15, 30, 60, 120 min) etching, curve (2)