Biomedical Engineering Reference
In-Depth Information
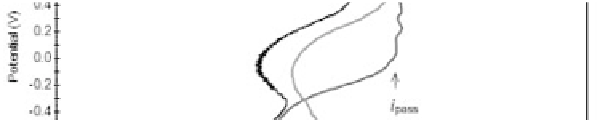
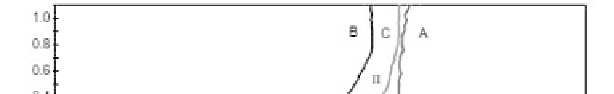
Figure 5.25
Potentiodynamic polarization curves of Ti-35Nb-5Ta-7Zr
alloy in deaerated Ringer's solution at 37 ± 1°C: (A) bare, (B)
nanoporous, and (C) nanotubular alloy [40]. See also Color
Insert.
Table 5.7
Corrosion parameters from polarization plots [40]
Sample
E
corr
(V)
I
corr
(μA cm
-2
)
I
pass
(μA cm
-2
)
Bare
-0.805
0.87
18.14
Nanoporous
-0.728
0.76
8.68
Nanotubular
-0.754
3.12
12.57
Nanoporous anodized layer signiicantly improved the corrosion
resistance of the bare alloy. The nanotubular surface exhibits
passivation behavior similar to the nanoporous surface. The
passive region I extended over a wide potential range for both the
nanoporous and nanotubular alloy (Fig. 5.25). The bare alloy shows
a steady passivation (region II). The current density corresponding
to the passivation region (
I
pass
) for both the nanoporous and
nanotubular alloy was nobler than for the bare alloy, but the
nanotubular alloy exhibited signiicantly higher corrosion current
density (
I
corr
) values. The nanoporous surface consist perfectly
passive pits due to the higher barrier oxide thickness and compact
pore walls [40]. For the nanotubular surface, the tubes may act as
the more effective channels for the electrolyte to reach the interface.
The lower corrosion resistance of the nanotubular alloy surface may
be associated with the concave shaped tube bottom and the distinctly
separated tube bottom/barrier oxide interface [40].