Biomedical Engineering Reference
In-Depth Information
(a)
(b)
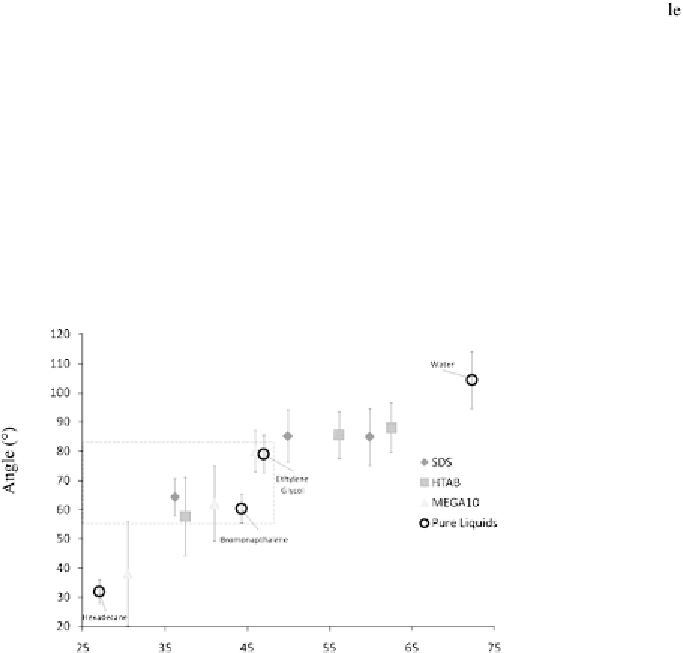
Figure 8.
Average contact angle of surfactant solutions and pure liquids on (a) Teflon AF coated and
(b) OTS coated, smooth silicon wafer. The end points of the bars on symbols mark the advancing (top
end) and receding (bottom end) contact angle. Standard deviation of advancing and receding contact
angles are less than
∼
2.6
◦
.
tions for the same range of intrinsic (smooth surface) contact angles. On Figs 9-11,
the modified Cassie prediction has been plotted for comparison with results, with
the dashed regions of the lines an extrapolation to super-CMC SDS concentrations,
they predict the higher concentration (but still sub CMC) contact angles for HTAB
and MEGA 10 well, as argued at the end of Section F.1.
The increase in surfactant solution wetting compared to pure liquid wetting is
most apparent in Fig. 9 for PTFE. Here two distinct regions have been drawn de-


Search WWH ::

Custom Search