Biomedical Engineering Reference
In-Depth Information
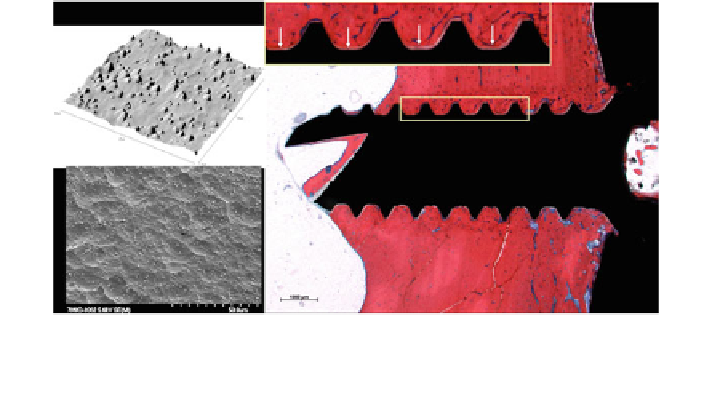
Fig. 3 Standard surface of microrough TAN as used in clinics. This surface has a characteristic
3D morphology with R
a
approximately 1 lm. Consequently, as depicted in the histological
section, this surface normally supports direct osseointegration (white arrows)[
35
]
groups use different scales of microroughness based on their own experimental
experience. For instance, Boyan and Schwartz [
82
] state that if the average
roughness of a surface is greater than the size of an individual osteoblast, then
essentially this surface may been seen as smooth since the distance between peaks
is too great to be detected. The interpretation of Boyan and Schwartz of a
roughness spectrum suggests that an average roughness less than 2 lm will sup-
port a fibroblast-like morphology, whereas an average roughness more than 2 lm
but with a peak-to-peak distance exceeding 10 lm (the suggested size of an
average osteoblast) will also be perceived by a cell as smooth and will conse-
quently induce a fibroblast-like morphology. In contrast, if the average roughness
is greater than 2 lm but the peak-to-peak distance is less than 10 lm, then the
osteoblast cells are unable to spread, and as a result they adopt a more typical
osteoblast cuboidal morphology (Fig.
5
). This observation is fundamentally the
same point that was made much earlier by Brunette [
83
], who reported that if the
peak-to-peak distance is less than the length of the cell body, then osteoblasts
assume their characteristic cuboidal morphology, but if it is greater, a well-spread
fibroblast-like morphology is assumed. Although the theory itself makes sense, one
point that may go against the spectrum set by Boyan and Schwartz is the fact that
osteoblasts in practice (depending on their origin, i.e. species, primary vs. cell line)
can range in size; therefore, the defined spectrum laid out may only be effective for
specific osteoblasts, i.e. MG-63 as used by Boyan and and Schwartz.
Richards [
3
] identified a spectrum of roughness between 0.2-2 lm which is
believed to provoke the optimal differences in cell behaviour for smooth versus
rough samples. Below 200 nm (even as low as 10 nm) cells react in vitro with
varying degrees of phenotypic change, but these changes have limited in vivo
support.
This
may
be
because
the
proteins
attaching
to
the
surface
upon
Search WWH ::

Custom Search