Biomedical Engineering Reference
In-Depth Information
10
1
34 min
6h 7min
6h 20min
6h 40min
6h 57min
7h 25min
8h 25min
10
0
10
−
1
10
−
2
10
−
1
10
0
10
1
10
2
10
3
ω
(rad s
−
1
)
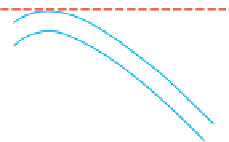
Figure 3.11
Winter
-
Chambon criteria for crystallization of iPPS: loss tangent against frequency at various
times of crystallization (T = 146°C). Gelation time is marked by the horizontal dashed line.
Reproduced from Schwittay et al.(
1995
) by permission of the Royal Society of Chemistry.
Figure 3.12
Winter
-
Chambon criteria: exponent n versus concentration for gelatin gels: (a) gelation;
(b) melting. Corresponding temperatures for gelation or melting are also shown on the figures.
Adapted from Michon et al.(
1996
) © Wiley-VCH Verlag GmbH & Co. KGaA. Reproduced with
permission.
concentration, between 17% and 40% g cm
−
3
. Michon et al.(
1996
) reported different
values for the exponent n during gelation and melting of gelatin gels, as shown in
Figure 3.12
at various temperatures and concentrations, which contradicts the previous
description of the gelation process.
Although most of the available data for gelation of physical or chemical gels gives
exponents n > 0.5, one can see in
Figure 3.12
that some values determined at high gelatin
concentrations are below this value. The plots also indicate that the gelation temperature
of gelatin solutions is a function of concentration.
It is known that the underlying mechanism of network formation in gelatin gels is the
formation of triple helices of the collagen type. There is no equilibrium for the structure at


Search WWH ::

Custom Search