Biomedical Engineering Reference
In-Depth Information
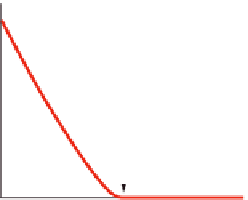
L
a
P
C
1
0.5
0
Fraction of uncut bonds (
p
)
Electrical network randomly cut and the electric current corresponding to the fraction p of uncut
bonds.
Figure 3.4
used, the thermodynamic limit is reached when L/a
→
∞
, where L is the macroscopic size
of the sample and a is an atomic or molecular scale.
Percolation deals with dramatic changes in the connectivity of systems of in
nite size
around this so-called percolation threshold. The electrical analogy in
Figure 3.4
starts in a
connected state and the process describes a progressive decrease in the number of bonds.
A convenient way of comparing percolation and gelation is to imagine the process in the
other direction, i.e. by increasing the number of connections beginning with a totally
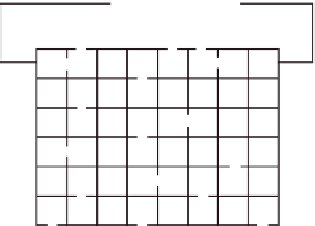
unconnected state. In
Figure 3.5
one can see an example of the site percolation process on
a square lattice.
The three frames show the lattice at three stages of the
filling process. The sites of the
lattice are initially empty, and they are occupied randomly by the heavy dots, which
represent the
filled sites. Nearest-neighbour
filled sites are connected by heavy lines and
belong to the same cluster. In the
first frame,
Figure 3.5a
, one can see clusters containing
between 1 and 4
filled sites.
The important variable is p, in this case the proportion of
filled sites; s is the number of
sites belonging to a cluster. In
Figure 3.5a
, p = 0.25; in
Figure 3.5b
, p = 0.50 and, while
the fraction p has increased, the size of the clusters has also increased.
Let n(s) be the normalized number of clusters of size s:
number of clusters of size
s
total number of sites
n
ð
s
Þ¼
:
ð
3
:
5
Þ


Search WWH ::

Custom Search