Biomedical Engineering Reference
In-Depth Information
discussed in
Chapter 7
, to include mixtures of the two. Interpretations were again made in
terms of failure envelopes and the use of the BST equation.
Finally it is worth noting that microscopy images of phase separated mixed gels often
appear quite complex, just as they do in
Figures 10.6
and
10.7
. Images sometimes seem
to consist not of two pure, discretely separated phases but of a hierarchy of inclusions of
mini-phases within phase separated regions, in a self-similar pattern. This is actually
what is predicted if phase separation proceeds by spinodal decomposition rather than by
nucleation and growth, and may ultimately lead to the anticipated bicontinuous structure.
Much work has been performed on such effects in the phase separation of synthetic
polymer blends, but such observations have not been widely reported for mixed gels,
although observational evidence in the form of microscopy images has been reported.
10.4.1.4
Casein
dextran
Casein (
Chapter 9
) is a major milk protein. At constant temperature and pH, the stability
limit of the system water
-
neutral polysaccharide is determined by changing the
concentration of the polymers and salt.
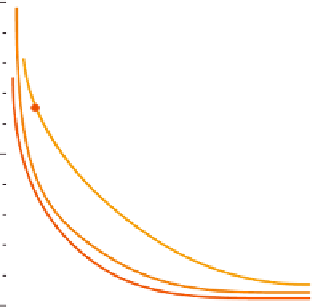
Figure 10.8
shows the phase diagram of the
water
-
casein
-
dextran system for various NaCl concentrations, plotted not in the tradi-
tional triangular form but in the Tolstoguzov form, showing c
2
(concentration of the
protein, casein) and c
3
(concentration of the polysaccharide, dextran) for
-
casein
-
fixed salt
concentrations at pH 6.5 and 25°C. As the salt concentration increases from 0.15 M,
the binodal curve shifts to lower concentrations.
To
NaCl
system, a two-phase system was prepared at 25°C, one of the phases (in most cases that
enriched with a polysaccharide) was selected and its behaviour studied under heating. In
find out how temperature affects the stability of the water
-
casein
-
dextran
-
10
5
0
0
5
10
15
c
2
(%)
Phase diagram of water
-
casein
-
dextran in the presence of NaCl with various concentrations
determined by cloud point observation at pH 6.5 and 25°C; c
2
is the concentration of casein and c
3
is that of dextran. The two-phase state is above the curves and the single phase is below the curves.
Concentration of NaCl: 0.15 M (
●
), 0.3 M (
○
), 0.5 M (
◑
). Reprinted with permission from Antonov
et al.(
1977
) © 1977 Springer.
Figure 10.8


Search WWH ::

Custom Search