Biomedical Engineering Reference
In-Depth Information
10
4
10
3
10
2
10
1
10
0
10
1
10
2
10
3
10
4
Time (s)
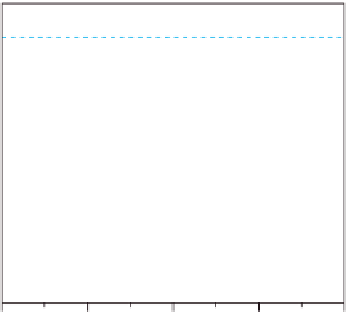
Typical results for the gelation kinetics (G
0
)of
β
-Lg, heated at pH 7 to 80°C: 13.0%w/w (
□
), 13.2%
w/w (
Δ
), 13.5% w/w (×), 14.0% w/w (
◊
), 14.8% w/w (
○
), 15.9% w/w (
●
), 16.7% w/w (
▲
).
Reproduced with permission from Kavanagh et al.(
2000a
) © 2000 American Chemical Society.
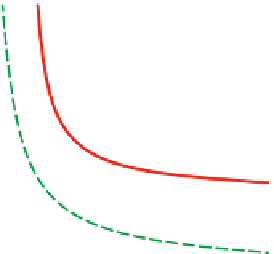
Figure 9.3
380
370
360
GEL
350
340
β
-Lg
330
SOL
BSA
320
0
5
10
15
20
c
(% w/w)
Tobitani diagram of infinite gelation time as a function of concentration and temperature.
Reproduced with permission from Tobitani and Ross-Murphy (
1997a
) © 1997 American Chemical
Society.
Figure 9.4
One approach which may have potential for further generalization is the
pseudo-kinetic model suggested by Tobitani and Ross-Murphy (
1997a
,
1997b
). In this
model, the gelation time is the investigated parameter. A series of experiments is carried
out, and the actual gelation time corresponding to a particular concentration and temper-
ature established. By interpolation and extrapolation of the data set, a locus of nominally
in
nite gelation time is established, which is a useful form of state diagram (
Figure 9.4
).
In the diagram the upper region represents the gel state and the lower the sol state. The
boundary between the sol and the gel regions corresponds to the gelation curve, and with


Search WWH ::

Custom Search