Biomedical Engineering Reference
In-Depth Information
15
N
c
=
10
N
c
=
9
10
N
c
=
8
N
c
=
7
N
c
=
5
N
c
=
6
5
N
c
=
4
N
c
=
3
N
c
=
2
N
c
=
1
0
0
100
Elongation (%)
200
300
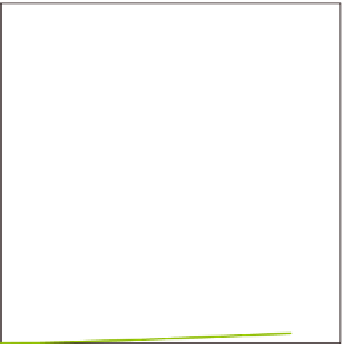
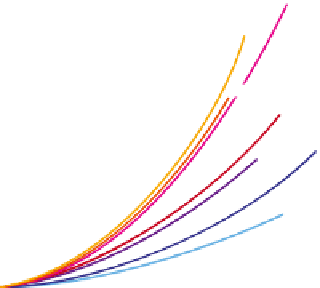
Stress
strain curves for c = 15 wt% PVA cryogels during N
c
consecutive freeze/thaw cycles.
Adapted with permission from Yokoyama et al.(
1986
) © 1986 Springer.
-
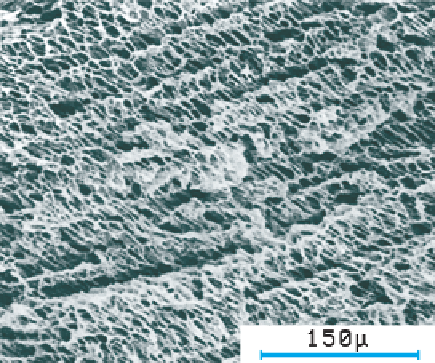
Figure 8.16
Scanning electron micrograph of a xerogel obtained from 5 wt% PVA cryogel (N
c
= 10). Adapted
with permission from Yokoyama et al.(
1986
) © 1986 Springer.
Figure 8.17
Yokoyama et al.(
1986
) considered that the repeated freezing stages are nothing but
repeated recrystallizations, and regarded the cycling as a kind of re
nement process for
ice crystals. They therefore expected that polymer chains would be rejected from the
growing ice crystals as an
water system was frozen. Thus
the concentration of PVA in the PVA-rich solution phase would increase with the freezing
cycle number, and in the PVA-poor solution phase would decrease, giving rise to the
porous structure. They observed that the pore size in the xerogel increased on lowering of
the concentration of PVA. However, they reported shrinkage of the gels (for N
c
>3
'
impurity
'
whenever the PVA
-
-
4)


Search WWH ::

Custom Search