Biomedical Engineering Reference
In-Depth Information
M
w
=
3
.0
×
10
4
M
w
/
M
n
<
1.05
30
20
10
(ii)
(ii)
Clear gel
0
−
10
(iii)
(iv)
−
20
0
25
10 0
Concentration (g L
−
1
)
50
75
125
150
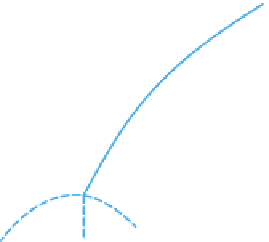
Phase diagram of narrowly dispersed aPS (M
w
= 3.0 × 10
4
g mol
−
1
)inCS
2
: (i) one-phase solution;
(ii) one-phase gel; (iii) two-phase solution; (iv) two-phase gel. Adapted with permission from Tan
et al.(
1983
) © 1983 American Chemical Society.
Figure 8.9
The phase diagram of narrow M
w
distribution aPS in CS
2
is given in
Figure 8.9
.Tan
et al.(
1983
) investigated other solvents including nitropropane, and the corresponding
phase diagram is shown in
Figure 8.10
. The temperature scale (ordinate) in each
figure is
centred around and normalized by the
-temperature of the corresponding M
w
of aPS and
the solvent species. The binodal line in nitropropane is broader than in CS
2
and is shifted
to higher polymer concentrations. These investigations depart from previous ones
because the gelation transition in these two solvents is distinct from the phase separation
boundary. It is interesting to note that the gelation curve for CS
2
in
Figure 8.9
is located
well above the
θ
-temperature and is therefore not related to the binodal line, and it
intersects the binodal above the upper critical solution concentration. In nitropropane
(
Figure 8.10
), a continuous gelation curve is observed across the binodal regime.
Consequently, a turbid gel can be formed in nitropropane either from a turbid solution
or from a transparent gel. Upon cooling a one-phase solution containing 190 g L
−
1
or less,
the solution becomes a two-phase turbid solution which then transforms into a two-phase
turbid gel. On the other hand, at 270 g L
−
1
a one-phase solution forms a one-phase gel,
which then becomes a turbid gel when cooled further.
Tan et al.(
1983
) showed that stable thermoreversible gels were obtained from all M
w
investigated, and in a large number of solvents. As the temperature was lowered, when gels
formed from relatively dilute solutions they exhibited syneresis, followed by phase sepa-
ration, indicated by turbidity. Once formed, the gels were insoluble in an excess of the
same solvent. The gelation temperature T
gel
and gel melting temperature T
m
of aPS gels in
the transparent gel region were found to be identical; gels aged for 2 weeks remained
transparent and no change in T
m
occurred. From these observations with T
gel
= T
m
,andthe
absence of any detectable time-dependent phenomena, the authors concluded that the aPS
gel system had reached an equilibrium state.
θ


Search WWH ::

Custom Search