Biomedical Engineering Reference
In-Depth Information
Chapter 8
). The authors, however, warn that in their scenario the occurrence of the coil
-
helix transition underlies gelation and is responsible for the thermal hysteresis, although
the evidence suggests that the hysteresis re
ects the subsequent aggregation. The coil
-
helix transition
and their interaction with water. Since double helices
can be approximated as rod-like particles, the phase diagram of Flory
'
alters the solutes
'
Onsager type
might also be relevant from a qualitative point of view, but the topological constraints
among helices prevent the occurrence of an actual nematic ordering (see also the
discussion in
Chapter 3
).
Ayma rd et al.(
2001
) re-examined the phase diagram at a
-
fixed concentration (2 wt%),
considered as a
by the previous authors, with particular emphasis on
the thermal history and time dependence, particularly in the range 36
'
high concentration
'
-
43°C. From their
work, it was con
rmed that the cooling rate plays a major role on the state of aggregation, as
first established in the early work byDea et al.(
1972
) and in subsequent rheological studies.
Again, the growth rate of the gel modulus, as followed by small-strain dynamic
measurements, was dramatically reduced above 35°C, so longer isothermal curing was
required for this modulus to tend towards a pseudo-plateau value or to enter a regime of
slower growth (up to 6 days at 43°C). Gelation always took place after the
final temper-
ature was reached; however, kinetic effects were not totally suppressed, within the
finite
long-time scale investigated. Rather than a concentration range, the temperature range
35
-
43°C appears as a boundary between different types of gelation. Turbidity measure-
ments performed at various temperatures by quenching and annealing the sample, as for
the rheology, also showed marked differences. Samples quenched above 35°C showed a
dramatic change in turbidity, whose wavelength dependence suggested the formation of
large-scale
fluctuations of concentration in the system, i.e. polymer-rich and polymer-
poor regions (
Figure 7.21
).
10
10 0
90
80
70
60
50
1
T
(
°
C)
43
41.5
38
34.4
20
10
0.1
40
30
20
10
0
0.01
1
10
100
1000
10000
Time (min)
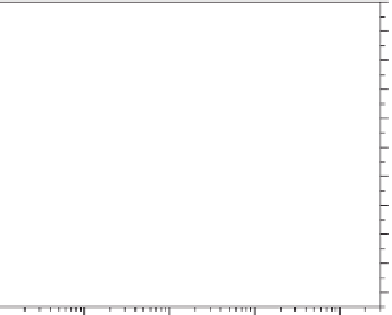
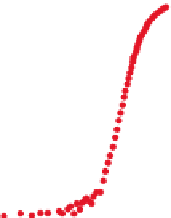
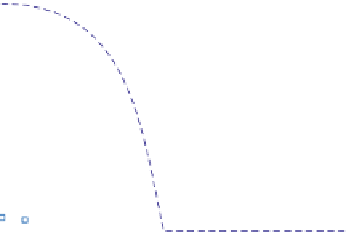
Figure 7.21
Time course of the turbidity measured at 800 nm for an agarose solution at 2 wt%, cured
isothermally. The cooling temperature pro
le is indicated on the right-hand scale. Adapted from
Aymard et al.(
2001
) with permission of John Wiley & Sons.


Search WWH ::

Custom Search