Biomedical Engineering Reference
In-Depth Information
where c is the number concentration of monomers, N is the number of monomers of the
chain, N
ent
is the number of monomers in an entanglement strand and N
S
is the average
number of monomers along the chain between the S stickers:
N
N
S
¼
1
:
ð
4
:
24
Þ
S
þ
On time scales t >
, the stickers open, the stress due to the stickers relaxes and the
modulus drops to the level G
2
of the identical linear entangled chains without stickers:
τ
:
1
N
ent
G
2
cRT
ð
4
:
25
Þ
The second plateau G
2
persists until it reaches the terminal relaxation time T
d
of the
reversible network, given by
1
:
5
2S
2
N
N
ent
τ
T
d
p
0
2
:
ð
4
:
26
Þ
1
9
=
p
0
þ
12
=
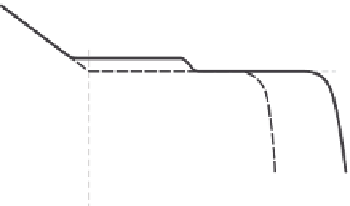
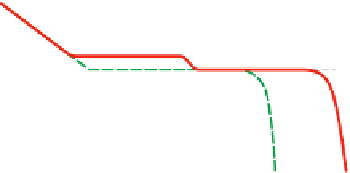
The predictions of the LRC model are summarized in
Figure 4.15
. T
d
is enhanced
signi
ed polymers T
d
because, for
cantly relative to that of unmodi
τ
>
τ
e
, the stickers
retard the reptation process. At the same time, the G
00
(
ω
) spectrum shows two maxima,
one at high frequency, corresponding to 1/
and independent of the degree of substitution,
and the other at 1/T
d
for the longest relaxation time, and which depends on p
0
.
The prediction for the zero-shear viscosity from the sticky reptation model is given by
τ
1
:
5
2S
2
cRT
N
ent
N
N
ent
τ
¼
G
2
T
d
¼
p
0
2
:
ð
4
:
27
Þ
1
9
=
p
0
þ
12
=
Experimental evidence for this model is discussed by Candau et al.(
1998
), Regalado
et al.(
1999
) and Feldman et al.(
2009
), according to various chain architectures. The
G
1
G
2
τ
e
τ
T
d
0
T
d
log
t
Figure 4.15
Time-dependent relaxation moduli of reversible networks of linear chains with stickers (solid line)
and without stickers (dashed line). Adapted from Leibler et al.(
1991
) © 1991 American Chemical
Society.


Search WWH ::

Custom Search