Biomedical Engineering Reference
In-Depth Information
10.0
μ
m
(
a
)
25
(
d
)
20
15
10
1-E
1-D
5
0
0.01
0.1
1
10
100
1000
20
μ
m
1-C
1-B
(
b
)
(
c
)
10.0
μ
m
1-A
1234
Two theta (deg.)
56
789 0
1.19
μ
m
2.5
μ
m
Figure 13.1
Figure 13.3
(
b
)
(
a
)
10 nm
Figure 13.2
(
a
)
(
b
)
(
c
)
1
μ
m
1
μ
m
1
μ
m
(
d
)
(
e
)
(
f
)
2
μ
m
1
μ
m
1
μ
m
Figure 13.4
Figure 13.13
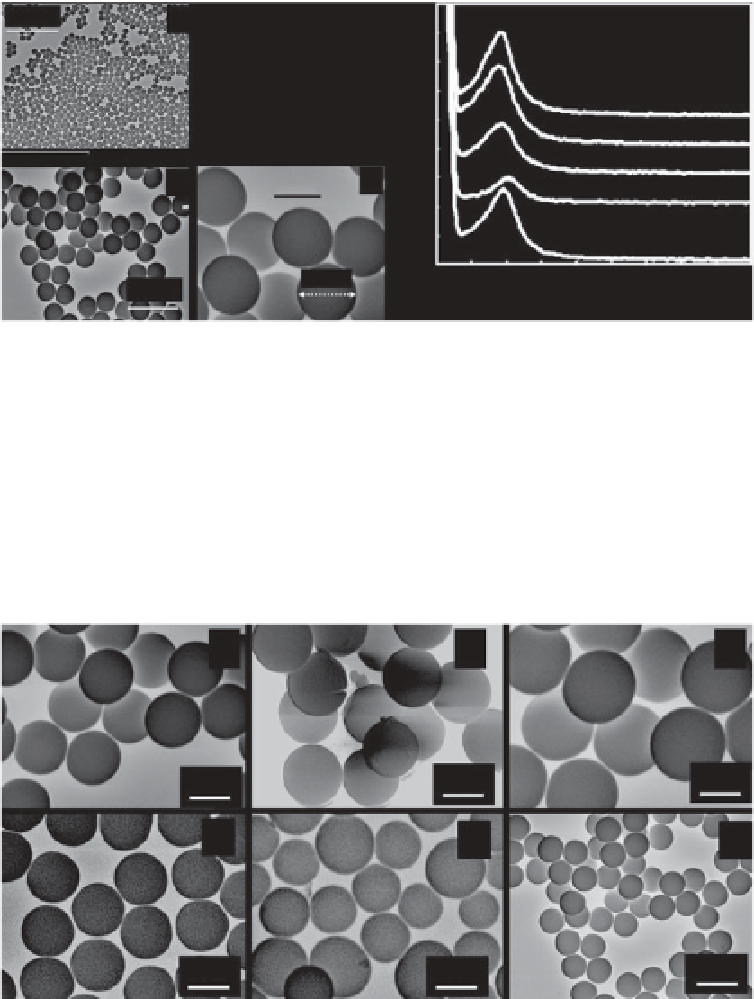
(Figure 13.1) (a-c) SEM image of sample 1-C with different
magnifi cation; (a) low resolution SEM image of sample 1-C, scale bar: 10
μ
m;
(b) the medium magnifi cation SEM images of sample 1-C, scale bar: 2.5
μ
m;
(c) high resolution SEM image of sample 1-C, scale bar: 1.0
m; the black dotted
line ending with arrows shows the MMS diameter of sample 1-C; (d) GMA result
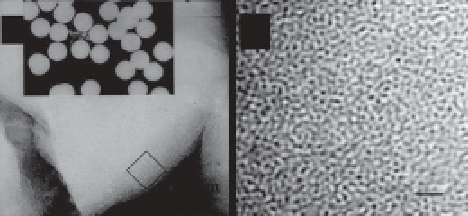
of samples 1. (Figure 13.2) TEM images of sample 1-C. The scale bar: (a) 100 nm,
(b) 10 nm. (Figure 13.3) X-ray diffraction patterns of MMS of samples.
(Figure 13.4) (a~e)
μ

Search WWH ::

Custom Search