Biomedical Engineering Reference
In-Depth Information
(a) HAp nanoparticles
(b) PLLA
(c) PLLA + HAp
mixture
-COO
-
Ca
+
-COO
-
2000
1900
1800
1700
1600
1500
Wavenumbers / cm
-1
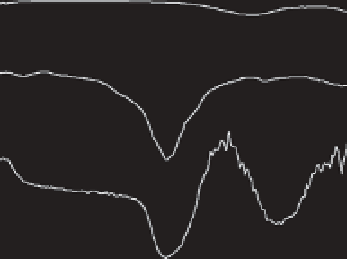
Figure 9.6
FT-IR spectra of (a) pure HAp nanoparticles, (b) PLLA homopolymer
and (c) the mixture of PLLA and the HAp nanoparticles. Reprinted with
permission from [52]. Copyright © 2009 American Chemical Society.
(
a
) HAp nanoparticle-stabilized
emulsion (Pickering emulsion)
(
b
) HAp nanoparticle-coated
PLLA microspheres
HAp nanoparticle
HAp nanoparticle
PLLA
50
μ
m
50
μ
m
CH
2
Cl
2
solution of PLLA
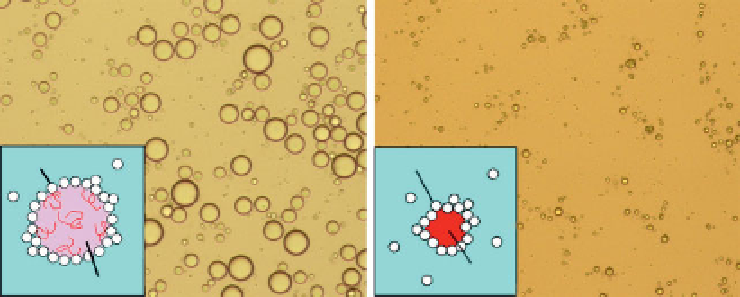
Figure 9.7
Representative optical micrographs of CH
2
Cl
2
solution of PLLA-in-
water emulsion stabilized with HAp nanoparticles as a particulate emulsifi er,
before (a) and after (b) evaporation of CH
2
Cl
2
from the emulsion. The images
were taken at the same area. The HAp-PLLA nanocomposite microspheres were
colloidally stable at least for 6 months at 4
C. Reprinted with permission from
[52]. Copyright 2009 American Chemical Society.
°
CH
2
Cl
2
as a Class II solvent and described that the concentration limit
of 600 ppm in a product can be applicable under the assumption that
the product mass of 10 g is administered daily [63]. The residual CH
2
Cl
2
amount in the microspheres produced in this study is one order of mag-
nitude lower than that limited in ICH. The surface of the nanocomposite


Search WWH ::

Custom Search