Biomedical Engineering Reference
In-Depth Information
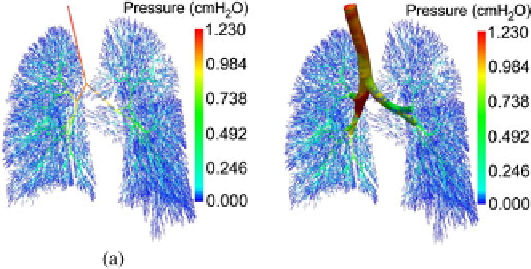
Fig. 28.5
Pressure distribution obtained in (
a
) a fully 0D simulation and (
b
) a coupled 3D-0D
simulation. In both cases, the trachea flowrate was 120 l/min. The pressure at the terminal airways
was taken to be zero. (
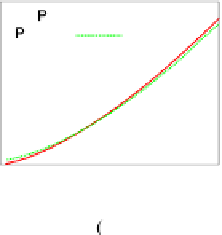
c
) Total bronchial pressure drop of models (
a
)and(
b
) at different inlet
flowrates
28.3.2 0D Model of Acini
To account for the influence of alveolar dynamics, we have proposed to introduce
simplified acinar models at all ends of the airway tree (Ismail et al.,
2012a
). Each ac-
inus is constructed from a tree of several alveolar ducts which are approximated by
Maxwell models (see Fig.
28.6
). Corresponding parameters have been determined
by calibrating the Maxwell model with 3D simulation results from the literature.
28.3.3 3D-0D Coupling
If detailed flow patterns in the larger airways are of interest, it seems reasonable to
utilize a combination of 3D and 0D airway models. Recently, we have developed
a novel coupling algorithm of 3D and reduced-dimensional models (Ismail et al.,
2012b
) based on the Neumann inflow boundary condition presented by Gravemeier
et al. (
2012
). This approach was shown to reproduce correct pressure levels and
resolve potential instabilities on inflow boundaries. Briefly, we first evaluate the
pressure on the 0D boundary using the flowrate of the 3D boundary. Subsequently,