Biomedical Engineering Reference
In-Depth Information
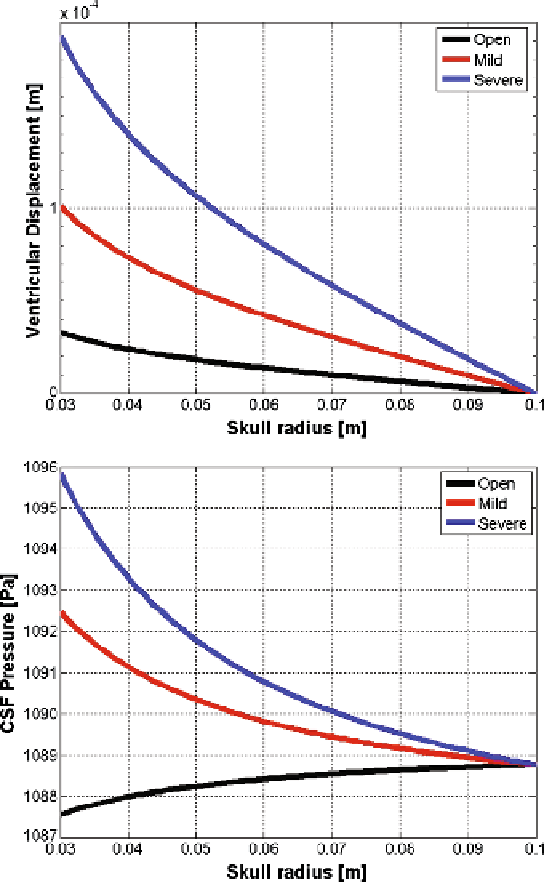
Fig. 22.4
Comparison of induced hydrocephalus behavior. The plots show results for ventricular
displacement and CSF pressure when varying the degree of aqueductal stenosis
b
2
)/
2
)
1
/
2
.Both
a
and
b
are the
major and minor axis of an ellipse. Finally,
μ
e
is the dynamic viscosity of CSF, and
is taken as 8
.
9
2
π((a
2
area and
P
is the perimeter, given by
P
=
+
10
−
4
Ns
/
m
2
.
These results reasonably resemble those of Howden et al. (
2007
), although the
artificially stenosed cases obviously differ due to differences in implementing the
stenosis. It was also clear from the work currently undertaken that the central canal
·