Biomedical Engineering Reference
In-Depth Information
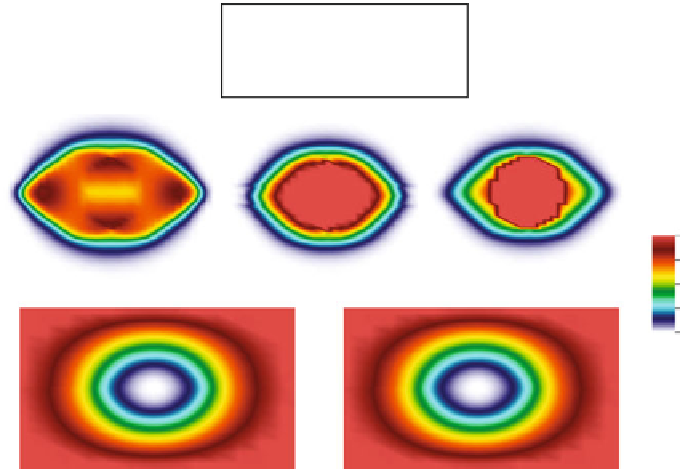
Fig. 21.5
Spatial distribution of species concentration after 10 days of growth. All the concentra-
tion values have been normalized. The formation of nutrient a depleted region at the center of the
tumor leading to increased cell death can be observed
Fig. 21.6
Evolution of total cell concentration (cancer cells and stem cells) in the presence of an
underlying secondary population of cancer stem cells. Also plotted are contour lines (
pink
-cancer
cells,
blue
-stem cells) showing the dominant regions of the two cell populations. The stem cell
population is assumed to be eccentrically-located in the initial tumor spheroid, and the stem cells
are modeled to be more proliferative by reducing their doubling time by 10 % compared to the
doubling time of the primary cancer cells
•
Study of proliferation and migration mechanisms:
One of our primary moti-
vations for simulating tumor growth was to use the numerical framework to probe
the possible mechanisms that cause symmetry-breaking in tumor shape leading
to formation of ellipsoidally shaped tumors (Mills et al.,
2012
). The first mecha-
nism we considered was the existence of microscopic compliant planes in the tu-
mor growth matrix along which the stress produced by growth of tumors would be