Biomedical Engineering Reference
In-Depth Information
Fig. 19.4
Boundary conditions for CED on a horizontal brain section corresponding to a usual
application dose. At the brain cortex and at the inner ventricle, an efflux of interstitial fluid and
therapeutic agents over the surface is possible
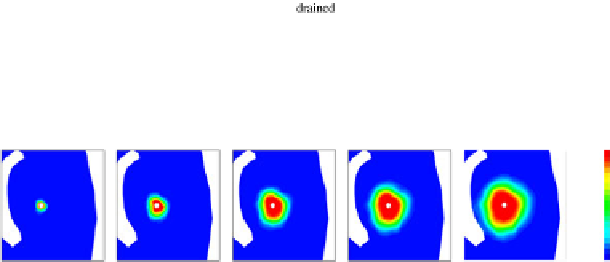
Fig. 19.5
Anisotropic distribution of the therapeutic agent during a CED process
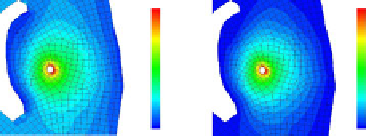
Fig. 19.6
Left
: Volume
fraction
n
I
of the interstitial
fluid.
Right
: Interstitial fluid
excess pressure
p
IR
during
the infusion process
the anisotropic concentration profile in the region of interest (ROI) close to the in-
fusion point at different time steps (in total three days). The therapeutic agent is
distributed as expected in an irregular manner due to the anisotropic permeability
parameters. Moreover, the propagation front is not smooth. The largest value of the
interstitial fluid volume fraction, cf. Fig.
19.6
, is found at the administration site of
the catheter, as the solid constituent is dilated as a result of the infused solution.
The excess pressure is a result of the infusion and naturally maximizes at the in-
fusion site of the catheter, whereas the resulting pressure values are still moderate
due to the small application rate. Note that the infusion pressure strongly depends
on the infusion rate, the stiffness of the solid skeleton, and the tissue permeabilities.
Note again that the present example is rather a numerical study than an approach
on the basis of secure and patient-specific data. Nevertheless, numerical studies are
important and provide the basis for a variety of computational results. For example,
a decrease in the permeability parameters of the interstitial fluid would result in a
faster increase of the infusion pressure, cf. Fig
19.7
. This is an important aspect in
the strategy of a clinical intervention, as a critical local pressure at the infusion site
could lead to life-threatening effects due to large local dilatations of the tissue.