Biomedical Engineering Reference
In-Depth Information
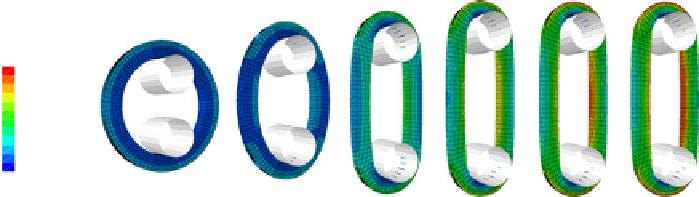
Fig. 10.5
Different stages of the myograph experiment, with the
color code
depicting the maxi-
mum principal stress. In stages
a
,
b
and
c
the rods are being pulled to the preload force (step 6 of
the numerical simulation). In stages
d
,
e
and
f
the rods remain in position and the smooth muscle
cells are activated (step 7 of the numerical simulation)
10.5.3 A Different Clamp Design
The power of the proposed framework is that damage assessment can be performed
for different loading situations without having to perform new experiments. As a
proof of concept, the simulations described above were repeated for the exact same
geometry, but with a wavy clamp design, similar to a typical mosquito clamp used in
surgery. Mesh density for this simulation was increased to nine elements through the
thickness as more severe bending was expected. Clamping was simulated up to the
same macroscopic clamping force as with the smooth clamp design. The clamping
simulation was performed in Abaqus/Explicit, as it has a better capability of dealing
with complex contact situations.
10.6 Results
The top left image in Fig.
10.4
shows the maximum principal stress in an arterial
segment in the systolic physiological state. This state defines the free energy thresh-
old above which damage is initiated. In the middle left image of the same figure,
the maximum principal stress is shown for the same arterial segment when clamped
up to a clamping force of 5 mN with a smooth clamp design. The bottom left image
shows the segment when it is clamped to the same clamping force with a mosquito
clamp. As shown in the right column of Fig.
10.4
, the clamping induced an inhomo-
geneous damage pattern to the smooth muscle cells in both clamping cases.
Figure
10.5
shows snapshots of the myograph experiment, with the color code
depicting the maximum principal stress. The right graph of Fig.
10.6
shows the
force measured in the rods of the myograph as a function of time, for a previously
undamaged segment, solid line, and for a segment that was previously clamped at
5 mN with a smooth clamp, dashed line, and for a segment that was previously
clamped with a mosquito clamp, dotted line. The letters along the curve correspond
to the stages shown in Fig.
10.5
. The first section of the graph corresponds to step