Biomedical Engineering Reference
In-Depth Information
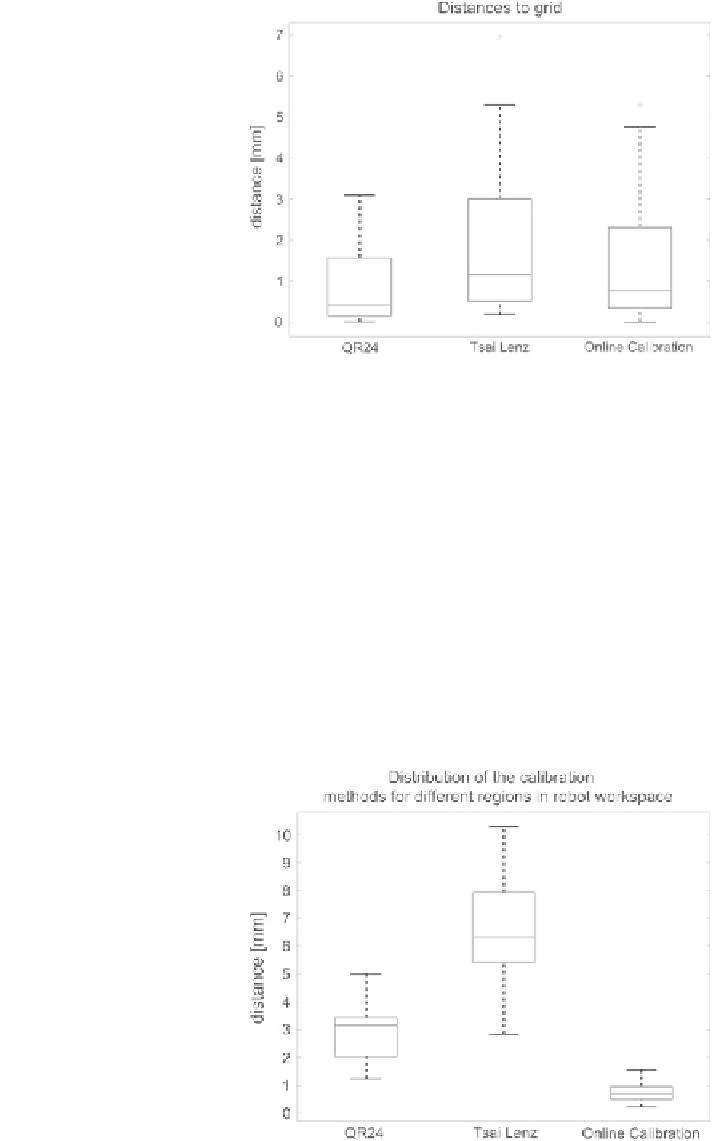
Fig. 4.9 Comparison of the
distances of the different
calibration methods to the
3
3
3 grid spaced at
100 mm
The estimated variances are shown in Fig.
4.10
. We have found that the mean
translational variances for the hand-eye calibration methods are 2.94 mm and
6.43 mm for the QR24 algorithm and the method by Tsai and Lenz, respectively.
Interestingly, the variance of the online calibration method is smallest with
0.75 mm. The mean rotational variances for the hand-eye calibration methods are
0.089
and 0.165
, respectively. For the online calibration method the mean rota-
tional variance is 0.039
. The calculated values are also summarized in Table
4.3
.
A scatter plot (Fig.
4.11
) shows the distribution of the estimated translational
parts of the calibrations. As shown above, the online calibration is more evenly
distributed compared to the hand-eye calibration methods. A possible reason for
this could be the position of the additional marker at link three. When calibration is
performed in different regions of the robot's workspace, the position of the marker
on the robot's third link does not change strongly. Consequently, its detection by
Fig. 4.10 Variance of the
different calibration methods
for different regions in the
robot workspace
Search WWH ::

Custom Search