Biomedical Engineering Reference
In-Depth Information
a cosine and will have a correlation of 1.0.
Figure 2.4-8
shows the correlations between a sine and a cosine as the
sine is shifted relative to the cosine.
Figure 2.4-8
(lower
right) plots a cosine/sine correlation against time shift for
a 2-Hz sine. When the sine is shifted by 0.125 seconds,
corresponding to a phase shift of 90 degrees, the corre-
lation reaches a maximum value of 1.0, after which it
begins to decrease to a minimum of
1.0 at 0.375 sec-
onds, corresponding to a shift of 270 degrees.
The effect of shifting the reference waveform shown in
Figure 2.4-8
suggests an approach for using correlation to
search for general signal properties such as oscillatory
behavior. Rather than correlate the signal with either a sine
or a cosine, correlate the signal using a sine time-shifted by
different amounts, performing the correlation operation
(Eq.
2.4.28
) at each time shift. The maximum correlation
will describe how much the signal is like a sinusoid. (Al-
ternatively, a cosine could be used as the reference with
similar results, although the shift required for maximum
correlation would be different.) This approach also pro-
vides information on how much time shifting is required
to achieve the maximum correlation, which may be of
interest in some applications. This approach is demon-
strated in Example 2.4.11 at the end of this chapter.
When correlation is performed by time-shifting one
waveform with respect to another, it is termed
cross-
correlation.
This shifting correlation can be achieved by
introducing a variable time delay, or time lag, or simply
lag,
into one of the two waveforms in the correlation. It
The equation for covariance is similar to the discrete
form of correlation except that the average values of the
signals have been removed. Of course, if the signals have
average values of zero, the two discrete operations
(unnormalized correlation and covariance) are the same.
More extensive use of correlation is presented in the
section on MATLAB implementation.
2.4.3.2 Autocorrelation
and cross-correlation
The mathematical dissimilarity between a sine and
a cosine is disconcerting and a real problem if you are
trying to determine if a signal has general sinusoidal-like
features. For example, a signal could be quite similar to
a cosine, but if you are correlating using a sine wave
reference, you would find only a small correlation. The
same would be true if you were probing a sinelike signal
with a cosine reference function. You might think that
these signals are not sinusoidal when in fact they were
very much like a sinusoid, just not the one you selected as
a reference. To circumvent this problem, you could still
use only a sine (or cosine) reference, but shift this ref-
erence signal in time, performing the correlation for
many different time shifts. For example, comparing
a cosine with a shifted sine shows increasing correlation
with greater shifts. When the sine is shifted so that its
phase is modified by 90 degrees, it will be identical to
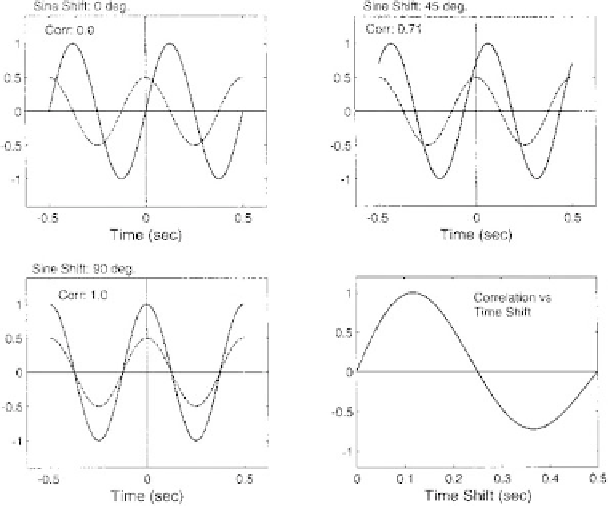
Figure 2.4-8 Upper left: The correlation between a 2-Hz cosine reference (dashed line) and an unshifted 2-Hz sine is 0.0. Upper right:
When the sine time is shifted by the equivalent of 45 degrees, the correlation is 0.71. Lower left: When the sine is shifted by 90 degrees,
the two functions are identical and the correlation is 1.0. Lower right: A plot of the correlation between cosine and sine as a function of the
sine shift shows a peak value of 1.0 for a shift of 0.125 seconds corresponding to a shift of 90 degrees, a zero at 0.25 seconds cor-
responding to a shift of 180 degrees, and a correlation of -1.0 at a time shift of 0.375 seconds, corresponding to a shift of 270 degrees.