Biomedical Engineering Reference
In-Depth Information
2.4.2 Signal properties: basic
measurements
applied to a signal to extract more information, while
other analyses can be used to probe the signal for spe-
cific features. Transformations can be used to provide
a different view of the signal. In this section, basic
measurements are described followed by more involved
analyses.
One of the most straightforward of signal measure-
ments is the assessment of its average value. Averaging is
most easily described in the digital domain. To determine
the average of a series of numbers, simply add the
numbers together and divide by the length of the series
(i.e., the number of terms in the series). This is mathe-
matically stated as follows:
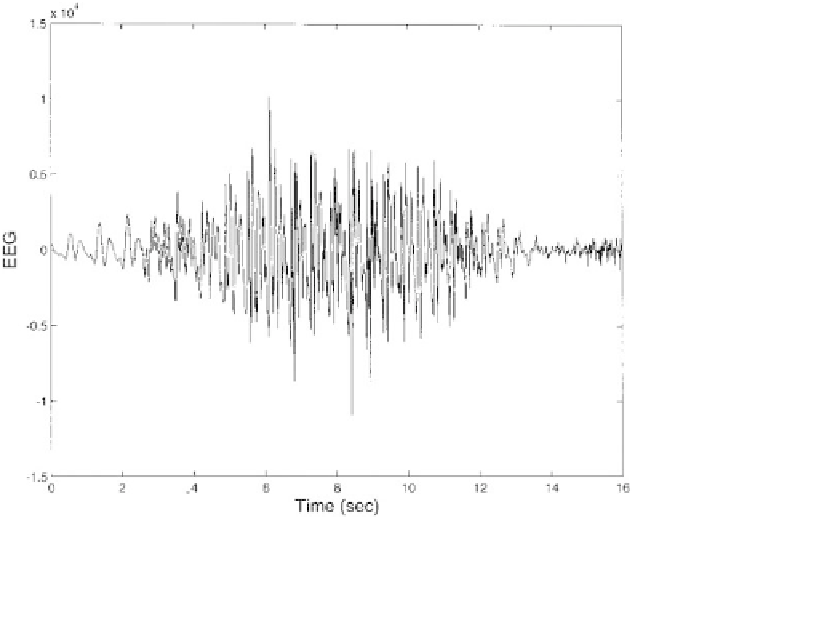
Biosignals and other information-bearing signals are often
quite complicated and defy a straightforward analytical
description. An archetype biomedical signal is the elec-
trical activity of the brain as it is detected on the scalp by
electrodes, the electroencephalogram (EEG) shown in
Figure 2.4-4
. Although a time display of this signal, as in
Figure 2.4-4
, constitutes a unique description, the
information carried by this signal is not apparent from
the time display, at least not to the untrained eye.
Nonetheless, physicians and technicians are trained to
extract useful diagnostic information by examining the
time display of biomedical signals including the EEG.
The time display of the electrocardiogram (ECG) signal
is so medically useful that it is displayed continuously for
patients undergoing surgery or those admitted to in-
tensive care units (ICUs). This signal has become an in-
dispensable image in television and movie medical
dramas. Medical images, which can be thought of as two-
dimensional signals, often need only visual inspection to
provide information useful for diagnosis.
For some signals, a simple time display provides
useful information, but many biomedical signals are not
easy to interpret from their time characteristics alone.
Nearly all signals will benefit from some additional signal
processing. For example, the time display of the EEG
signal in
Figure 2.4-4
may have meaning for a trained
neurologist, but it is likely to be uninterpretable to most
readers. A number of basic measurements can be
N
X
N
x
avg
¼ x ¼
1
x
k
[Eq. 2.4.13]
k ¼
1
where
k
is an index number indicating a specific number
in the series. The bar over the
x
in Eq.
2.4.13
stands for
''the average of.''. Equation
2.4.13
would be appropri-
ate only for finding the average of a digital signal. An
analog signal is a continuous function of time,
x
(
t
), so the
summation becomes an integration. The average or mean
of a continuous signal, the continuous version of
Eq.
2.4.13
, is obtained by integrating the signal over time
and dividing by the time length of the signal:
ð
T
xðtÞ¼
1
T
xðtÞdt
[Eq. 2.4.14]
0
Note that the primary difference between digital and
analog domain equations is the conversion of summation
Figure 2.4-4 Segment of an electroencephalogram signal. (From the PhysioNet data bank, Goldberger et al., 2000.)