Biomedical Engineering Reference
In-Depth Information
q
2
ð
1
:
602
10
19
Þð
20
10
3
Þ
10
6
i
nd
¼
p
2
qI
d
BW
¼
¼
8
:
00
10
8
amps
q
1
:
7
10
20
ð
10
6
=
200
Þ
q
4
kT
B
W=R
i
nR
¼
¼
¼
9
:
22
10
9
amps
q
i
nd
þi
nR
¼
p
6
:
4
10
15
þ
8
:
5
10
17
i
nT
¼
¼
8
:
1
10
8
amps
Note that most of the current noise is coming from the
diode, so the addition of the resistor's current noise does
not contribute much to the diode noise current. The
mathematics in this example could be simplified by cal-
culating the square of the noise current (i.e., not taking
the square roots) and using those values to get the total
noise before taking the square roots.
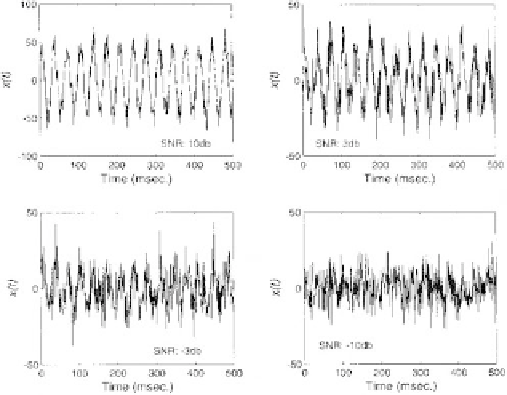
Figure 2.3-12 A 30-Hz sine wave with varying amounts of
added noise. The sine wave is barely discernible when the signal-
to-noise ratio is 3 dB and not visible when the signal-to-noise
ratio is 10 dB.
the noise in RMS units.
Figure 2.3-12
shows a sinusoidal
signal with various amounts of white noise. Note that it
is difficult to detect the presence of the signal visually
when the SNR is
3 dB, and impossible when the SNR
is
10 dB.
2.3.4.2 Signal-to-noise ratio
Most waveforms consist of signal plus noise mixed to-
gether. As noted previously, signal and noise are relative
terms, relative to the task: the signal is that portion of the
waveform of interest whereas the noise is everything
else. Often the goal of signal processing is to separate out
a signal from noise, identify the presence of a signal
buried in noise, or detect features of a signal buried in
noise.
The relative amount of signal and noise present in
a waveform is usually quantified by the
signal-to-noise
ratio
(SNR). As the name implies, this is simply the ratio
of signal to noise, both measured in RMS (root-mean-
squared) amplitude. This measurement is rigorously
defined in the next chapter. The SNR is often expressed
in decibels (dB) where:
2.3.5 Summary
Biological systems include a variety of physiological
processes ranging from the organ level through the cel-
lular level to the molecular level. Classic physiology is
structured around large-scale biological systems such as
the cardiovascular system, the endocrine system, the
gastrointestinal system, and others. All biological systems
communicate with one another, and with themselves, via
biosignals. Such signals are carried by electrical, chem-
ical, mechanical, or thermal energy. All signals involve
some form of coding process. For analog signals, the in-
formation is encoded into the amplitude of the signal at
any given instant in time. If these analog signals are
processed by digital computers, they must be converted
to digital format, a process that involves slicing the signal
in both amplitude and time. Amplitude slicing is known
as
SNR
¼
20 log
signal
noise
[Eq. 2.3.12]
To convert from decibel scale to a linear scale:
quantization,
whereas
time
slicing
is
known
as
sampling.
The field of linear systems analysis encompasses
analog and systems processes. Both representations use
linear elements so that this analysis only applies to linear
processes or processes that can be taken, or approxi-
mated, as linear. Electrical analog models are used to
analyze electric circuits and to represent physiological
processes. Mechanical analog models can also be used
from either of these two perspectives. Examples were
SNR
Linear
¼
10
dB
=
20
[Eq. 2.3.13]
For example, an SNR of 20 dB means that the RMS
value of the signal is 10 times the RMS value of the
noise (10
(20/20)
¼
10),
þ
3 dB indicates a ratio of
1.414 (10
(3/20)
¼
1.414), 0 dB means the signal and
noise are equal in RMS value,
3 dB means that the
ratio is 1/1.414, and
20 dB means the signal is 1/10 of