Biomedical Engineering Reference
In-Depth Information
Figure 2.2-46 PV-loop of normal cardiovascular conditions.
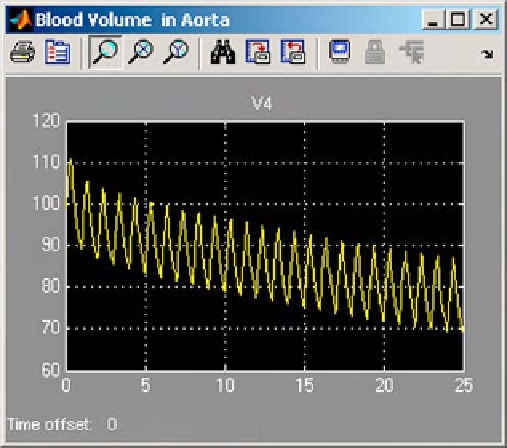
Figure 2.2-45 Blood volume in aorta.
Under normal conditions, the external work performed
by the left ventricle is confined within the boundaries that
show the interaction between the end-systolic pressure-
volume relationship (ESPVR) and end-diastolic pressure-
volume relationship (EDPVR). The place where the
ESPVR is tangent to the PV-loop represents the point at
which the aortic valve closes. The corresponding EDPVR
tangent line is proportional to the reciprocal of ventricular
compliance. In addition, the area under the loop represents
the mechanical work performed by the ventricle, and the
width of the loop corresponds to the difference between
end diastolic volume and end systolic volume, defining the
stroke volume (Li, 2004)
Example 2.2.12 Pressure-volume loops.
Modify the Simulink implementation of PHYSBE so that
a PV-loop can be created in MATLAB. Use the PV-loop
to illustrate the dynamic characteristics of left ventric-
ular hypertrophy.
PV-loops are easily generated in MATLAB from
PHYSBE data by plotting left ventricular pressure against
left ventricular volume, measurements that were saved
to the MATLAB variables LV_Volume and LV_Pressure,
respectively. The PV-loops are generated with the
MATLAB script:
plot(LV_Volume,LV_Pressure)
ylabel('Left Ventricular Pressure')
xlabel('Left Ventricular Volume')
axis([0 500 0 1200])
Figure 2.2-47 PV-loop of patient with left ventricular hypertrophy.
and one representative of a patient with left ventricular
hypertrophy is shown in
Fig. 2.2-47
.
As expected in cases of left ventricular hypertrophy,
there is a leftward and upward shift in the ESPVR, and
a shift in the PV-loop itself. The total area enclosed by
each loop was reduced, reflecting a decrease in stroke
work and volume. If the stroke volume is decreased, the
heart rate must increase in order to maintain a normal
cardiac output. Eventually, if left untreated, this adaptive
effect will fail and cardiac output will fall.
This PHYSBE simulation shows that left ventricular
hypertrophy is a compensatory mechanism for main-
taining normal cardiac output under abnormal increases
The pressure-volume loop diagram of the left ven-
tricle is constructed based on the filling, contraction,
ejection, and relaxation of the left ventricle. A PV-loop of
normal cardiovascular conditions is shown in
Fig. 2.2-46
,


