Biomedical Engineering Reference
In-Depth Information
narrowing of each valve leads to a decrease in the
corresponding pressure gradient. The arterial compliance
(
C ¼ DV
/
DP
) will decrease in response to an impaired
pressure gradient caused by valve dysfunction, reflecting
the change in blood volume due to the decreasing arterial
pressure. This model then predicts that the blood
volume in the transport vessels must increase, leading to
a decrease in left ventricular blood volume.
PHYSBE can be used to model left ventricular hy-
pertrophy indirectly by first modeling inadequate aortic
and pulmonary valves. The weakened valves induce left
ventricular pressure overloading and a reduction in blood
flow through the valves. This condition gives rise to left
ventricular hypertrophy.
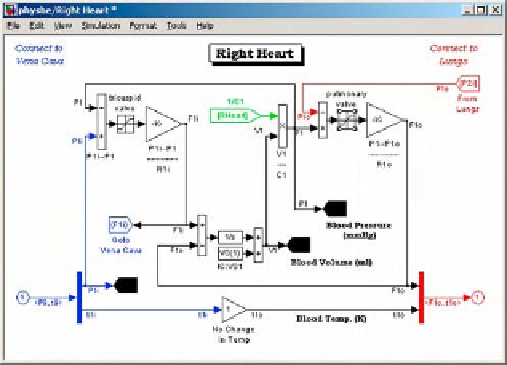
Weakened aortic and pulmonary valves can be mod-
eled by changing the upper limits of the aortic and pul-
monary valves in the left heart (
Fig. 2.2-41
) and right
heart (
Fig. 2.2-42
), respectively.
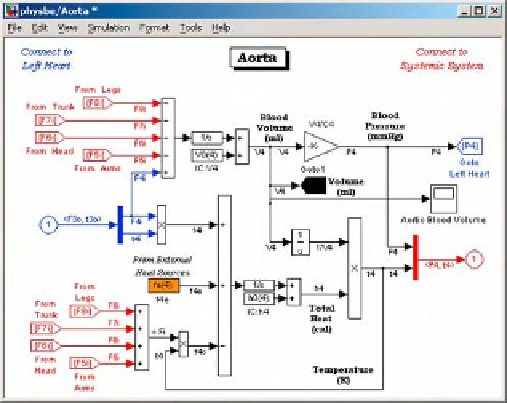
In addition to the scope output of the left ventricular
pressure in the left heart, a scope should be added to the
aorta to show the effect on aortic blood volume (
Fig. 2.2-43
).
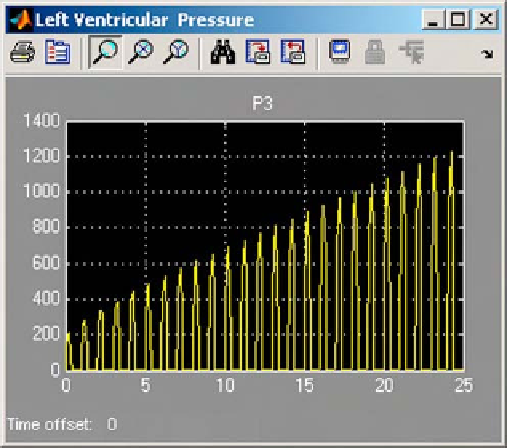
Left ventricular hypertrophy is characterized by an
increase in pressure in the left ventricle (
Fig. 2.2-44
).
The volume of blood in the aorta decreases com-
mensurately with the increase in pressure in left ven-
tricular hypertrophy (
Fig. 2.2-45
).
The Pressure-Volume (PV) loop is a graphical tool for
assessing the interplay of ventricular function and circulation.
Example 2.2.11 Left ventricular hypertrophy.
Modify the Simulink implementation of PHYSBE to
model left ventricular hypertrophy.
Figure 2.2-43 Modeling left ventricular hypertrophy: aorta.
Figure 2.2-41 Modeling left ventricular hypertrophy: left heart.
Figure 2.2-42 Modeling left ventricular hypertrophy: right heart.
Figure 2.2-44 Left ventricular pressure.