Biomedical Engineering Reference
In-Depth Information
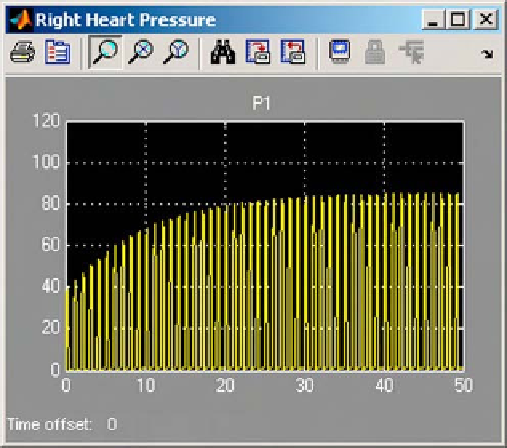
Figure 2.2-37 Right heart pressure.
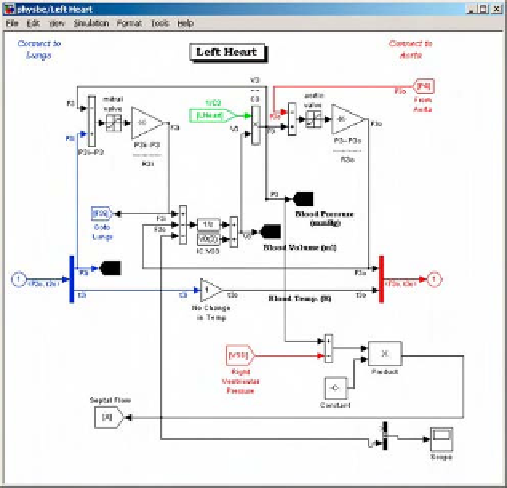
Figure 2.2-35 PHYSBE model of the left heart with VSD.
This simulation of VSD predicts that the blood pres-
sure in the left heart reaches a steady state value that is
less than the normal pressure, whereas the pressure in the
right heart increases significantly. This pressure change is
consistent with theory since the right ventricle has an
increased flow from the left ventricle. (See
Figs. 2.2-36
and
2.2-37
.)
In this simulation, a hole greater than one square cen-
timeter was modeled. The theory would predict that with
a hole this size, a considerable amount of blood would be
in the right ventricle and the blood volume in the pul-
monary arteries would increase. The increased blood
This difference is divided by resistance, as determined
by the Bernoulli equation:
mmHg
$
s
mL
8
ð
3cP
Þð
4mm
Þ
p
r
4
¼
0
:
2292
r
4
with
r
in millimeters. The reciprocal (since the formula
calls for division) represents the constant
C
in
Fig. 2.2-
34
. This difference is subtracted from the left heart flow
rate, and added to the right heart flow rate, shown in
Fig. 2.2-34
for the left heart, and appears as a source
block in the model of the right heart, above.
Figure 2.2-36 Left heart pressure.
Figure 2.2-38 Left heart volume.


