Biomedical Engineering Reference
In-Depth Information
Figure 2.2-29 Pressure as a function of time during Aortic
Valve Stenosis, from
Klabunde (2004)
.
Figure 2.2-30 Aortic stenosis: heart pressure simulation results.
resistance is
F ¼ DP/R
, an increase in resistance should
result in a decrease in blood flow out of the heart. If not
enough blood is being ejected from the heart, and if
blood flow is not high enough, the necessary oxygen and
other nutrients, which the tissues need to survive, will
not be efficiently delivered via the vascular system. The
decrease in flow also triggers a homeostatic response
within the body to compensate for the loss of blood flow.
The left ventricle has to pump harder and thus fatigues at
a faster rate than a normal heart.
In addition, as a result of the increased resistance,
blood cannot escape the heart, specifically the left ven-
tricle, as quickly as under normal conditions. Thus the
The PHYSBE model does not allow for changing
physical parameters such as the radius of the aortic valve,
which would be the most accurate model. Therefore, in
order to model an aortic valve stenosis using PHYSBE,
the resistance (
R
0
) of the left heart was increased. When
stenosis occurs and the radius of the valve decreases, the
resistance to blood flow increases, since resistance is in-
versely proportional to radius as given by Poiseuille's Law
(
Germann, 2005
). The physiological effect of a stenosis
is a decrease in blood flow due to the increase in re-
sistance (due to the decrease in radius) as modeled by the
relationship
F ¼ DP/R
, where
F
is blood flow,
DP
is the
change in pressure, and
R
is the resistance. This decrease
in blood flow was used to show whether or not an aortic
valve stenosis was modeled.
The resistance was changed from 0.0125 mmHg/mL/s
to 0.135 mmHg/mL/s, which is a physiologically relevant
value for an aortic stenosis. This value was obtained by
converting the value for severe aortic stenosis, 180 dyne s,
which was reported by
Mascherbauer (2004)
.
When there is an aortic stenosis, maximum heart
pressure within the left ventricle increases to over 160
mmHg (
Fig. 2.2-30
).
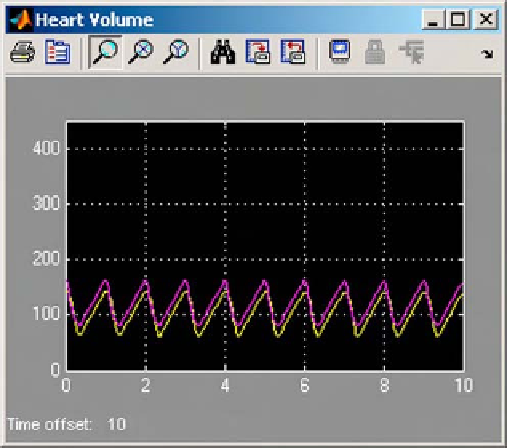
When an aortic valve stenosis occurs, the end systolic
volume, or the volume of blood left in the heart after
a single pump, increases to about 85 mL (
Fig. 2.2-31
).
In a normal heart, maximum flow out of the left
ventricle is about 925 mL/min (
Fig. 2.2-32
).
In the case of an aortic valve stenosis, the blood flow
out of the heart is cut in half to 460 mL/min (
Fig. 2.2-33
).
In this simulation, as in the pathophysiology, blockage
of the aortic valve results in an increased resistance to
blood flow, due to the inverse relationship of radius and
resistance. Because the relationship of blood flow to
Figure 2.2-31 Aortic stenosis: heart volume simulation results.