Biomedical Engineering Reference
In-Depth Information
images could be viewed using stereo goggles and provided
the necessary left- and right-eye interleaving to produce
the virtual 3D volume-rendered image. Stereoscopic vi-
sualization represents a milestone in volume visualization
in terms of promoting its popularity and acceptance. The
traditional display methods that present a 3D object on
a 2D display do not make use of the depth perception as
a powerful visual cue to convey the 3D spatial in-
formation. Another powerful advantage of stereoscopic
3D visualization is its inherent ability to let the human
eye play the role of a 3D filter to suppress the effect of
noise in the image. Noise in images such as MRI volume
usually appears around structures of interest. When the
rendered image is presented in 2D, the noise appears
projected on the structures and obscures them. But when
the data are presented in 3D stereo, noise is resolved by
depth perception and poses little distraction when the
eye focuses on the structure of interest. The computa-
tional load doubles in stereoscopic 3D rendering because
it involves creating a pair of views.
that can describe the motion of the beating heart with its
three-dimensional dynamic properties
[35, 36]
.
Developmental visualization and 3D volume
morphing
The study of 3D shape changes in morphology is a chal-
lenging area of investigation, but in many cases there may
not be a unique way of deriving this information without
making certain assumptions. Such assumptions may
cause loss of generality, but in an investigative study,
posing those assumptions and visualizing the corre-
sponding results may provide a better understanding of
the functional information present in the image. One
such specific developmental visualization is in the field of
craniofacial modeling and visualization. For example,
given two different stages in the craniofacial de-
velopment in children with normal and abnormal growth,
it would be instructive to visualize how the normal and
abnormal growth functions would exhibit themselves if
they were expressed in the opposite group (Fig. 6.6-4).
To describe the growth function, usually homologous
landmarks that can be uniquely identified in craniofacial
morphology are provided in the two stages that describe
the growth. However, because there are few such ho-
mologous points (about 60), the visualization problem
here would be to interpolate the growth function over
the 3D space that represents the volume
[48]
. Using such
a growth function, one can then model the morphing
of the volume-rendered image to produce the de-
velopmental visualization. Thus, by applying the growth
function to a different subject, one could get a qualitative
Dynamic visualization
One of the simplest functional imaging examples is the
cine-MR technique used to image the beating of the heart
(
Figs. 6.6-2 and 6.6-3
). Displaying the slices as cine-
frames provides the motion cues that represent the
functional aspect of the beating heart. But in such a 2D
display, the through-image-plane motion would be sup-
pressed, amounting to moderation of actual motion.
Thus, volume rendering as a real-time display could
provide in one sequence all the necessary information
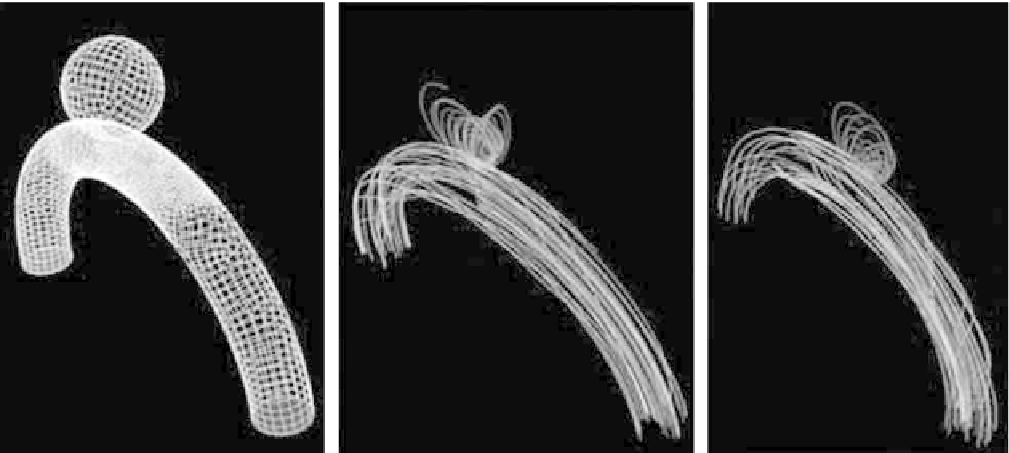
Figure 6.6-11 Modeling of the blood flow through an aneurysm and its visualization. (Left) Synthetic model. (Middle) Blood flow in
the absence of coils in aneurysm. (Right) When there are coils to reduce the blood flow, and thereby its potential to rupture. (Images
courtesy of TseMin Tsai, Jim Anderson.)