Biomedical Engineering Reference
In-Depth Information
Optimistically, the dire consequences of this ailment can
be almost completely eliminated with modern medical
techniques.
Coarctation is a sort-of ''pinch'' in the aorta located
between significant arterial branchings (
Sokolow and
McIlroy, 1981
). This pinch translates into a significantly
reduced aortic radius. Because blood flow rate immedi-
ately before, within, and after the pinch must remain
constant, velocity must increase (since
A ¼
p
r
2
will de-
crease) and this translates into a pressure gradient that
reduces
pressure to the lower extremities and trunk. A
reduction in pressure to the lower extremities and trunk
is implemented in Simulink with the addition of a re-
sistance to the flow entering these regions. The target
change in pressure is generated by this resistance
according to Ohm's relation
Q ¼ DP/R
(Li, 2004).
Example 2.2.8 Simulink model of coarctation of the
aorta.
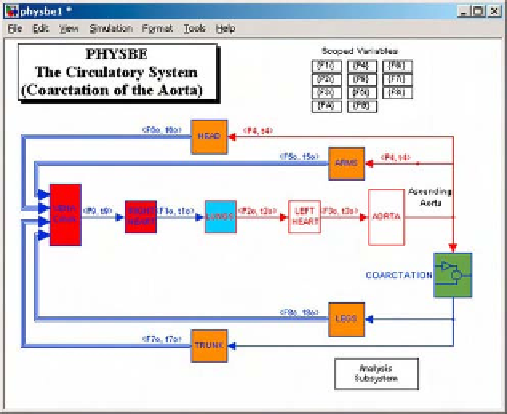
Figure 2.2-25 Location of coarctation subsystem in circulatory
system.
Modify the Simulink implementation of PHYSBE to
model a coarctation of the aorta and predict the effect on
blood pressure and volume in the heart.
The only direct modifications to the PHYSBE model
that need to be made are the addition of a resistance and
a pulse delay to the descending aorta.
In the Simulink model, the major modifications were
implemented in a subsystem format (for simplicity and
ease of use). The pulse delay was implemented via
a pulse delay block. The time-of-delay parameter input
to this block was 0.08 seconds. Data for the pulse delay
was in this range, and cited as anywhere between 0.1 and
0.08 seconds.
The resistance is implemented by adding a gain block
with a value equal to
1/R,
following the pulse delay and in
series with the vessels extending to legs and trunk. Be-
cause the value of this resistance is dependent upon
individual physiology, conditional geometry, and severity,
it can vary from case to case.
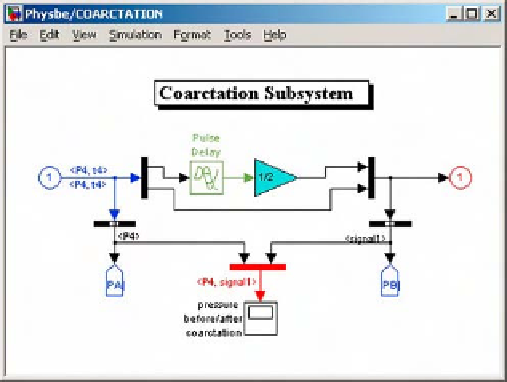
The coarctation subsystem (
Fig. 2.2-24
) is between
the ascending aorta and the legs (
Fig. 2.2-25
).
Lastly, the pressures on either side of the coarctation
are output to MATLAB objects for plotting and quanti-
fication purposes. These new MATLAB objects, called
PA and PB (pressure above and pressure below), are
visible in the coarctation subsystem in
Fig. 2.2-24
. These
objects were used by the PHYSBE Control and Analysis
subsection and shown as the 10
th
and 11
th
columns in the
modified PHYSBE Control Center.
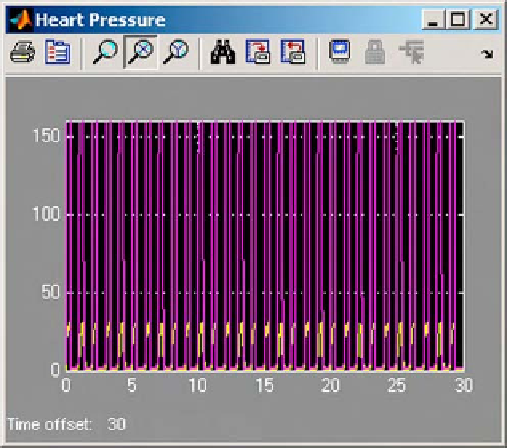
Figure 2.2-26 Heart pressure simulation results: right and left
ventricular pressures.
Figure 2.2-24 Coarctation subsystem.