Biomedical Engineering Reference
In-Depth Information
define a circular region, which completely encloses the
node (
Fig. 6.4-6
C). All pixels outside this circle mark the
background.
In the next step, an edge image is created using the
Sobel edge operator (
Fig. 6.4-6
D). The edge image has
high values for the pixels with strong edges. With the
seed point marking the node interior, the circle marking
the background (
Fig. 6.4-6
C), and the edge image gen-
erated by the Sobel operator (
Fig. 6.4-6
D), the seg-
mentation proceeds directly with the watershed
operation (
Fig. 6.4-6
E). The watershed operation oper-
ates on an edge image to separate the lymph node from
the surrounding tissue. By using a technique called sim-
ulated immersion
[119]
, the watershed considers
whether a drop of water at each point in the edge image
would flow to the interior seed point or the exterior
marker. Points that drain into the interior belong to the
lymph node, whereas points that drain to the exterior
belong to the surrounding tissue. More formal discus-
sions of morphological segmentation can be found in
Refs.
[75, 119, 120]
.
Watershed analysis has proven to be a powerful tool
for many 2D image-segmentation applications
[75]
.An
example of segmentation of microscopic image of human
retina is included in Ref.
[107]
. Higgins and Ojard
[43]
applied a 3D extension of the watershed algorithm to
cardiac volumetric images.
gray levels representing the direction of maximum local
gradient in the original image.
Most gradient operators in digital images involve cal-
culation of convolutions, e.g., weighted summations of
the pixel intensities in local neighborhoods. The weights
can be listed as a numerical array in a form corresponding
to the local image neighborhood (also known as a mask,
window or kernel). For example, in case of a 3
3 Sobel
edge operator, there are two 3
3 masks:
1
2
1
000
121
101
202
101
The first mask is used to compute
G
x
while the second is
used to compute
G
y
. The gradient magnitude image is
generated by combining
G
x
and
G
y
using Eq. 6.4.5.
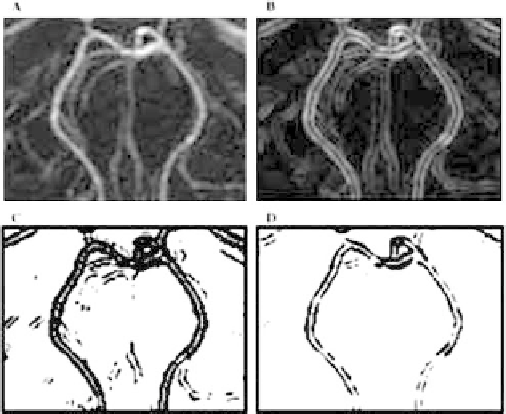
Figure 6.4-7
B shows an edge magnitude image obtained
with the 3
3 Sobel operator applied to the magnetic
resonance angiography (MRA) image of
Fig. 6.4-7
A.
The results of edge detection depend on the gradient
mask. Some of the other edge operators are Roberts,
Prewitt, Robinson, Kirsch, and Frei-Chen
[36, 41, 53,
96, 97]
.
Many edge detection methods use a gradient operator,
followed by a threshold operation on the gradient, in
order to decide whether an edge has been found
[12, 16,
25, 36, 41, 72, 96, 97, 107, 113]
. As a result, the output
is a binary image indicating where the edges are.
Figures
6.4-7C and 6.4-7D
show the results of thresholding at
two different levels. Please note that the selection of the
appropriate threshold is a difficult task. Edges displayed
in
Fig. 6.4-7
C include some background pixels around
6.4.5 Edge-based segmentation
techniques
An edge or boundary on an image is defined by the local
pixel intensity gradient. A gradient is an approximation
of the first-order derivative of the image function. For
a given image
f
(
x,y
), we can calculate the magnitude of
the gradient as
s
vf
vx
r
2
þ
vf
vy
2
h
G
x
þ G
y
i
jGj ¼
¼
(6.4.5)
and the direction of the gradient as
D ¼
tan
1
G
y
G
x
(6.4.6)
where
G
x
and
G
y
are gradients in directions
x
and
y
,
respectively. Since the discrete nature of digital image
does not allow the direct application of continuous dif-
ferentiation, calculation of the gradient is done by
differencing
[36]
.
Both magnitude and direction of the gradient can be
displayed as images. The magnitude image will have gray
levels that are proportional to the magnitude of the local
intensity changes, while the direction image will have
Figure 6.4-7 Edge detection using Sobel operator. (A) Original
angiography image showing blood vessels, (B) edge magnitude
image obtained with a 3 x 3 Sobel mask, (C) edge image
thresholded with a low threshold (300), (D) edge image
thresholded with a high threshold (600).