Biomedical Engineering Reference
In-Depth Information
%
D
¼
2500;
tau
¼
0.5;
% use ode45
[t,y]
¼
ode45(@renal,[0:0.5:240],[c0p0]);
plot(t,y(:,1),'b.');
xlabel('Time t (min)')
ylabel('Isotope concentration c(t)')
hold on
%
D
¼
2500;
tau
¼
10.0;
% use ode45
[t,y]
¼
ode45(@renal, [0:0.5:240], [c0 p0]) ;
plot(t,y(:,1), 'g:');
%
D
¼
2500;
tau
¼
240;
% use ode45
[t,y]
¼
ode45(@renal,[0:0.5:240],[c0 p0]);
plot(t,y(:,1), 'r
');
hold off
2.2.6 Correspondence problems
and motion estimation
A key concept in estimating motion from image se-
quences is that the relative motion between a pair of
images can be estimated from the correspondence of
a number of markers or features on the object(s). The
features must be uniquely identifiable, and it is often
assumed that the object is rigid or articulated.
Gait, the analysis of human body motion, is estimated
by recording the location of features on the hips and legs.
These features can be, for example, light emitting diodes
(LEDs), and the motion is recorded by having the subject
walk in a dark room. Many rehabilitation facilities have
gait laboratories where such recordings take place, and
the motion recorded can be used for diagnostic purposes.
This example, courtesy of Professor Charles Krousgrill
at Purdue University, illustrates how rotation matrices
can be estimated from the correspondence of markers on
the hips and legs (see
Fig. 2.2-18
).
Example 2.2.6 Estimating motion from features on
a rigid body.
In each case, the solution is run for 240 minutes in time
steps of 0.5 minutes. The set of solutions is shown in the
graph in
Fig. 2.2-17
. Notice that the first two solutions
have very similar trajectories; the traces of isotope con-
centration are the impulse response of the system to the
bolus radionuclide input, whereas the solution to the
ramp input (the dashed line) does not exhibit the feed-
back control at 240 minutes.
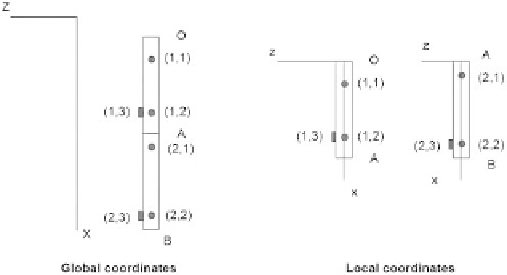
Six markers have been attached to the hip, thigh, and
lower leg, as shown in
Fig. 2.2-18
. The coordinates for
these markers are given in
Table 2.2-4
.
Position data have been collected for thesemarkers and
the hip from one frame of motion. These coordinates are
given in terms of global coordinates in 3D in
Table 2.2-5
.
Assuming a segment (thigh or lower leg) length of
18.13 inches, use the above data to determine the rota-
tion matrices for the thigh and lower leg. Determine the
3D global coordinates for the position of the ankle B.
The position of the markers on the hip and legs are
specified in
local
coordinates, 3D position with respect to
one of the markers. For this exercise, the hip is the ref-
erence marker for the markers on the thigh, and the knee
(position A) is the reference for the lower leg, all shown
Figure 2.2-17 Solutions to renal clearance program. Solid line:
bolus injection over 0.5 minutes; dotted line: injection over
10 minutes; dashed line: injection over 240 minutes.
Figure 2.2-18 Coordinate systems for gait markers on the hip
and legs, from Krousgrill (2005).