Biomedical Engineering Reference
In-Depth Information
2.
In the arithmetic task, subjects were asked to solve
a complex multiplication problem without speaking
or other muscle movements.
3.
In the geometric task, subjects were given 30 seconds
to study a drawing of a 3D block figure. After the
figure was removed, the subjects were instructed to
visualize the object rotating around an axis.
4.
In the letter composition task, the subjects were
instructed to mentally compose a letter to a friend
or relative without speaking. In the given study,
the tasks were repeated several times; during the
repetitions of the letter composition task, the
subjects were instructed to pick up where they left
off in the previous trial.
5.
In the visual counting task, subjects were asked to
visualize numbers being written on a blackboard. The
numbers were written sequentially, and each one was
erased before the next was written. As with the other
tasks, the subjects were asked not to speak, but simply
to visualize the numbers. In the repetitions of the
visual counting task, the subjects were told to pick up
counting where they left off in the previous trial.
These five cognitive tests were administered to seven
subjects as summarized in
Table 2.2-2
.
To the greatest extent possible, the tests were performed
without vocalization or physical movement. Each task was
repeated five times, in each session. From the chart above,
there were a total of 13 sessions; thus, there are
This simple example illustrates how to read the raw
PhysioBank data. Many of the processing and analysis
techniques shown here can now be applied to determine
the properties of this and other physiologic signals.
2.2.3 Signal processing: EEG data
EEG signals and their analysis are tools for (1) un-
derstanding the dynamic processes in the brain that are
the bases of physical and mental behavior and (2) local-
izing the source of the brain activity associated with
specific tasks or behaviors. The purpose of this example
is to determine whether or not there is differential brain
activity between the right and left hemispheres during
certain cognitive tasks.
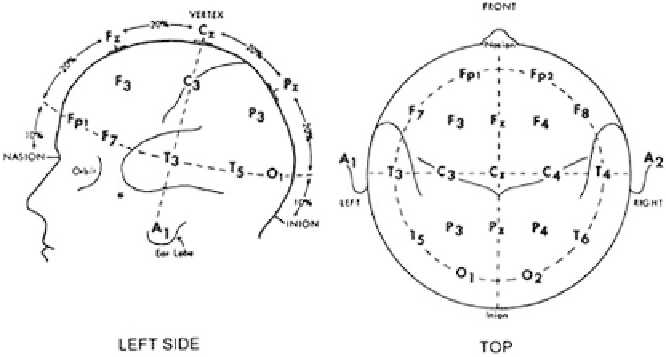
The standard convention for recording EEG data is
called the 10-20 system. The name 10-20 refers to the
percentage of arc length from nasion to inion through the
vertex, as shown in
Fig. 2.2-7
.
The signals recorded from A1 and A2 are reference
signals that record a signal called the electro-oculogram
(EOG): muscle artifact in the EEG signals that is due to
eye blinking.
The data for this project, from
Keirn (1988)
,is
publicly available from Professor Charles Anderson in
the Department of Computer Science at Colorado State
University.
In addition to the EOG,
signals were
recorded at O1, O2, P3, P4, and C3, C4.
The subjects in this study underwent the following
five tasks:
1.
In the resting or baseline task, the subjects opened
and closed their eyes and were asked to relax as
much as possible. In a resting phase, alpha waves
are produced and any left-right hemispheric
asymmetries can be determined so that they can
be subtracted from the measurements during
cognitive tasks.
13 (sessions)
5(tasks)
5(trialspertask)
¼
325 trials
in the complete dataset.
The complete dataset is available as a MATLAB
variable that is organized as a cell array. Recall from
Chapter 2.1b that a cell array is a data structure in
MATLAB used to organize data that is related but may be
of different
types (such as floating-point numbers,
Figure 2.2-7 The International 10-20 system for lead placement in EEG recordings, from
Jasper (1958)
.