Biomedical Engineering Reference
In-Depth Information
O
O
O
O
-C-N CH
2
N-C-O-CH
2
-CH
2
-CH
2
-CH
2
-O- -C-N CH
2
N-C-O- -CH
2
-CH
2
-CH
2
-O —
x
y
H
H
H
H
H1 H2 H5 H6 C1 C2
S1 S2 S3
H3 H4
Hard Segment
Chain Extender
Soft Segment
Carbon Label
Shift (ppm)
65
27
71
41
136
129
119
154
165
25
PTMO - CH
2
adjacent to urethane (S1)
PTMO - internal CH
2
(S2)
PTMO - external CH
2
(S3)
MDI CH
2
(H1)
MDI quarternary ring (H2/H5)
MDI protonated ring (H3)
MDI protonated ring (H4)
MDI urethane carbonyl (H6)
BD external CH
2
(C1)
BD external CH
2
(C2)
200
150
100
50
0
Frequency in ppm relative to TMS
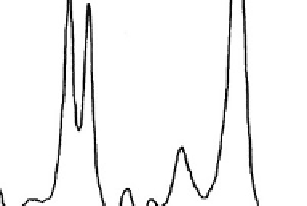
Fig. 3.2.2-14
13
C NMR spectrum and peak assignation of a polyurethane [diphenylmethane diisocyanate (MDI, hard segment),
polytetramethylene oxide (PTMO, soft segment), butanediol (BD, chain extender)]. Obtained by cross-polarization magic angle
spinning of the solid polymer. (From Okamoto, D. T., Ph.D. thesis, University of Wisconsin, 1991. Reproduced with permission.)
polymers. Samples are subjected to cyclic deformation at
a fixed frequency in the range of 1-1000 Hz. The stress
response is measured while the cyclic strain is applied
and the temperature is slowly increased (typically at
2-3 degrees/min). If the strain is a sinusoidal function
of time given by:
A typical plot of tan d versus temperature will
display maxima at
T
g
and at lower temperatures where
small-scale motions (secondary relaxations) can occur.
Additional peaks above
T
g
, corresponding to motions in
the crystalline phase and melting, are seen in semi-
crystalline materials. DMA is a sensitive tool for charac-
terizing polymers of similar chemical composition or
for detecting the presence of moderate quantities of
additives.
DSC is another method for probing thermal transi-
tions of polymers. A sample cell and a reference cell are
supplied energy at varying rates so that the temperatures
of the two cells remain equal. The temperature is in-
creased, typically at a rate of 10-20 degrees/min over the
range of interest, and the energy input required to
maintain equality of temperature in the two cells is
recorded. Plots of energy supplied versus average tem-
perature allow determination of
T
g
, crystallization tem-
perature (
T
c
), and
T
m
.
T
g
is taken as the temperature at
which one half the change in heat capacity,
DC
p
, has
occurred. The
T
c
and
T
m
are easily identified, as shown in
3
ð
u
Þ¼
3
o
sin
ð
u
tÞ
(3.2.2.7)
where 3 is the time-dependent strain, 3
o
is the strain
amplitude, u is the frequency of oscillation, and
t
is time,
the resulting stress can be expressed by:
s
ð
u
Þ¼
s
o
sin
ð
u
t þ
d
Þ
(3.2.2.8)
where s is the time-dependent stress, s
o
is the amplitude
of stress response, and d is the phase angle between stress
and strain. For Hookean solids, the stress and strain are
completely in phase (d
¼
0), while for purely viscous
liquids, the stress response lags by 90
. Real materials
demonstrate viscoelastic behavior where d has a value
between 0
and 90
.