Biomedical Engineering Reference
In-Depth Information
cross-covariance is a measure of the similarity of the
deviation of two signals about their respective means. An
example of the application of the autocovariance to the
analysis of heart rate variability is given in the next
section on MATLAB Implementation.
If x is an array or series of numbers (also termed a
vector
for reasons given later) the output of these routines is
a scalar representing the mean, variance, or standard
deviation. If x is a matrix, the output is a row vector
resulting from applying the appropriate calculation
(mean, variance, or standard deviation) to each column
of the matrix.
2.4.4 MATLAB implementation
Example 2.4.7:
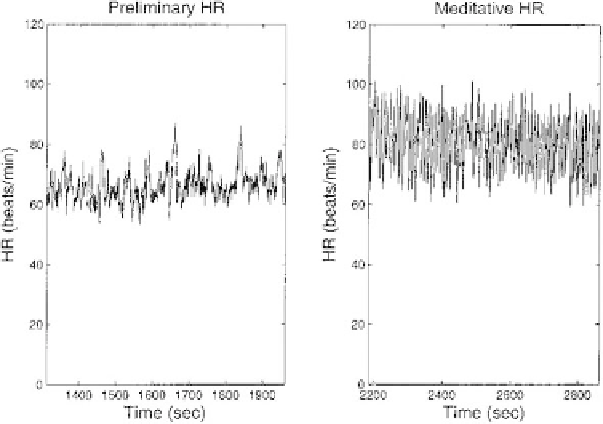
Figure 2.4-12
shows heart rate variability
for one subject under normal conditions (left side) and
during a meditative state. Find the mean and standard
deviation for the two conditions.
All of the analyses described thus far are relatively easy to
implement in MATLAB. In most cases, MATLAB has
a function that will perform these operations.
Solution:
Apply the MATLAB routines mean and std
(standard deviation) to the data. The program below
loads the heart rate data from the .mat files HR_pre
and HR_med. These files are assumed to be in
workspace in this example, but are found on the
accompanying CD. These files were originally
obtained from the PhysioNet database (
http://
www.physionet.org
) and contain approximately 500
seconds of heart rate data from a subject in a normal
(Hr_pre.mat)andmeditativestate(Hr_med.mat).
Each file contains a time variable (t_pre or t_med)
and a heart rate variable (hr_pre or hr_med). The
mean and standard deviation of the two heart rate
variables will be determined using the appropriate
MATLAB routines and the two variables plotted as
functions of time.
2.4.4.1 Mean, variance, and standard
deviation
Many of the techniques described in this chapter can
be expeditiously, and conveniently, implemented in
MATLAB. For example, the mean, variance, and stan-
dard deviations are implemented as shown in the three
code lines below.
xm
¼
mean (x); % Evaluate mean of x
xvar
¼
var (x); % Variance of x
normalizing by N-1
xnorm
¼
var(x,1); % Variance of x
normalizing by N
xstd
¼
std(x);
% Evaluate the standard
deviation of x
Example 2.4.7: Plot the mean and standard deviation of
the heart rate before and after meditation.
Figure 2.4-12 Heart rate over time during normal conditions (left) and during meditation (right). (From the PhysioNet database,
Goldberger et al., 2000.)