Biomedical Engineering Reference
In-Depth Information
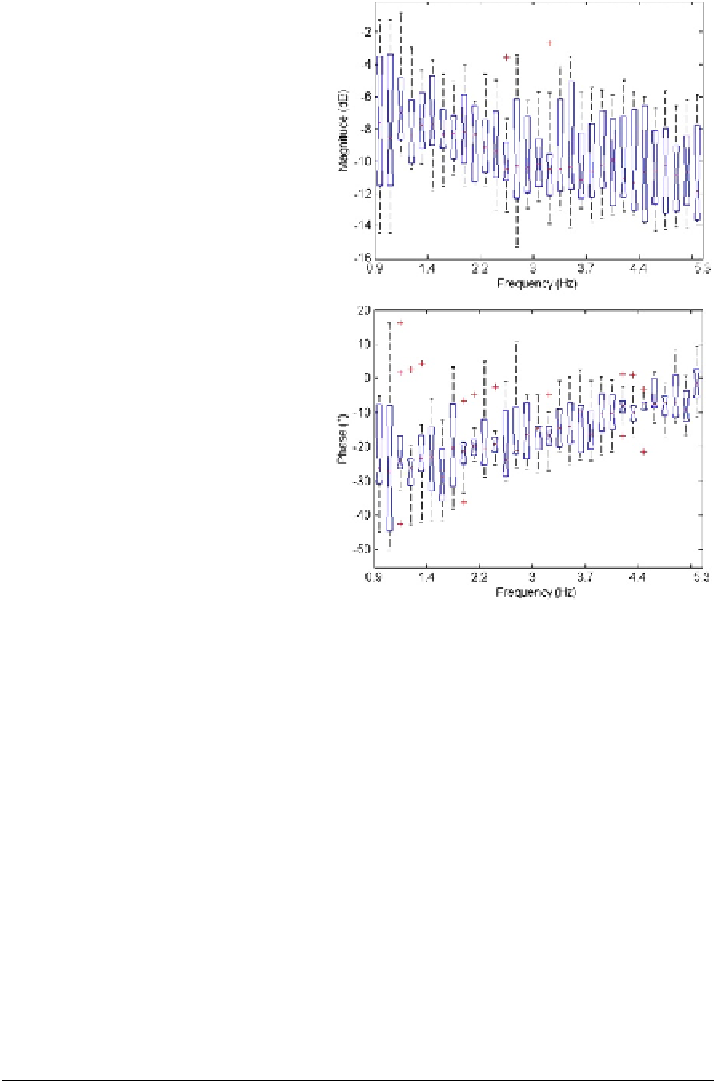
Fig. 5.17
The impedance by
means of its magnitude (
top
)
and phase (
bottom
) measured
from the 10 volunteers at low
frequencies. Each frequency
point is depicted by its mean
value, distribution, and
confidence intervals. Crosses
denote outliers defined as 1.5
times further than the mean
value
Ta b l e 5 . 4
Identified values for the ladder network from data in 10 healthy subjects at low frequen-
cies (0.5-5.7 Hz). See text for symbol explanations
R
UA
L
UA
C
UA
R
e
1
L
e
1
C
e
1
2
λ
2
/α
χ/
2
E
T
1
0.428
0.005
0.451
0.009
0.001
0.001
2.40
0.12
0.55
0.06
2
0.353
0.006
0.648
0.007
0.001
0.001
2.34
0.29
0.56
0.05
3
1.015
0.066
0.150
0.017
0.005
0.001
2.19
0.53
0.57
0.09
4
a
0.342
0.010
0.457
0.012
0.001
0.001
2.08
0.47
0.57
0.07
5
a
0.389
0.004
0.534
0.009
0.001
0.001
2.23
0.54
0.56
0.06
6s
0.854
0.015
1.434
0.027
0.005
0.001
2.17
0.51
0.57
0.09
7
0.365
0.080
0.286
0.004
0.002
0.001
2.25
0.49
0.60
0.03
8t
1.221
0.535
0.028
0.003
0.002
0.001
2.31
0.58
0.61
0.05
9
a
0.731
0.047
0.204
0.006
0.003
0.001
2.29
0.50
0.58
0.05
10
b
0.717
0.074
0.156
0.014
0.004
0.001
2.21
0.46
0.58
0.12
a
denotes occasional smoker
b
denotes outlier data: male, 59 years, 80 kg, 1.75 m; s denotes slim (53 kg); t denotes tall (1.90)