Biomedical Engineering Reference
In-Depth Information
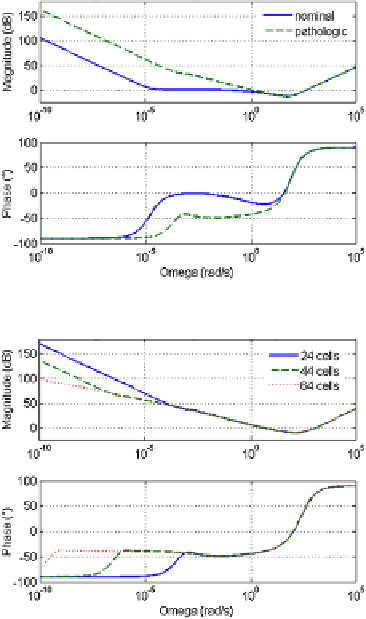
Fig. 5.12
Impedance by
means of Bode-plot
representation, for the
nominal and the pathologic
scenario
Fig. 5.13
For the pathologic
case, but with increasing
number of cells in the ladder
network (the extended
scenario)
to note that these ratios have a significantly different mean in the first part of the
respiratory tree (conductive zone) from that in the second part of it (respiratory
zone), hence we considered it necessary to vary them accordingly in the model.
In the
pathologic case
, due to the fact that airway morphology is affected by dis-
ease, changes occur in the mechanical parameters such that the overall resistance
increases and the compliance decreases (e.g. in chronic obstructive pulmonary dis-
ease) [
72
]. This results in the following ratios:
λ
=
1
.
127
,χ
=
1
.
220
,α
=
1
.
846
,
for
m
=
1
,...,
13
(5.43)
λ
=
1
.
167
,χ
=
1
.
226
,α
=
1
.
535
,
for
m
=
14
,...,
24
It is clear that the condition on
λ>
1 is fulfilled in the pathologic case. All other
conditions imposed as
αχ >
1
,αλ>
1, and
χ>
1 are also fulfilled. The
extended
case
consists of increasing the number of cells in the ladder network, while main-
taining the ratios from (
5.43
).
The simulated total input impedance is depicted by means of its equivalent Bode-
plot representation in Fig.
5.12
in the nominal case, in the pathologic case and in
Fig.
5.13
the extended case (varying the number of cells in the ladder network).
From the Bode plot, it is clear that the fractional-order behavior (phase locking)