Biomedical Engineering Reference
In-Depth Information
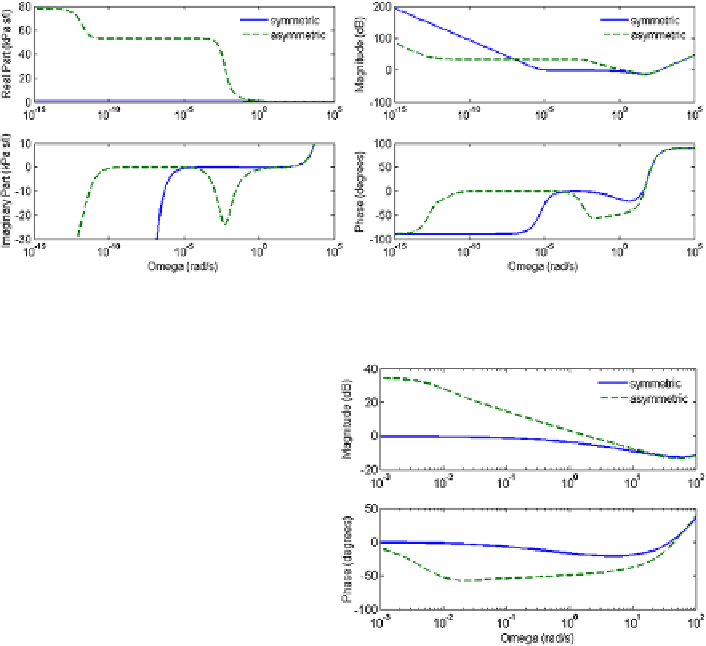
Fig. 5.8
Impedance by means of complex (
left
) and Bode-plot (
right
) representation, for the sym-
metric (
continuous line
) and the asymmetric (
dashed line
)tree
Fig. 5.9
Detailed view of the
impedance by means of the
Bode-plot representation, for
the symmetric (
continuous
line
) and the asymmetric
(
dashed line
)tree
for the symmetric and the asymmetric tree, whereas the airway tubes are modeled
by an
R
-
L
-
C
element in both representations.
It is significant to observe that in the frequency interval of clinical interest,
ω
∈
[
rad/s, the two impedances tend to behave similarly. A detail of Fig.
5.8
can be viewed in Fig.
5.9
. For the asymmetric case, we have a decrease of about
−
25
,
300
]
50
◦
, resulting in a fractional order
10 dB/dec and a phase of approximately
−
of
n
=
0
.
5. The constant-phase behavior is emphasized at frequencies below those
evaluated standardly in clinical practice, i.e. below 5 Hz. However, in the standard
clinical range of frequencies for the forced oscillation technique, namely 4-48 Hz,
both models give similar results, as depicted in Figs.
5.10
and
5.11
.
5.3 Relation Between Model Parameters and Physiology
5.3.1 A Simulation Study
For the simulations in this study, the admittance from (
5.17
) will be used, with ratios
calculated with (
5.4
) using morphological values from Table
2.1
. The respiratory