Biomedical Engineering Reference
In-Depth Information
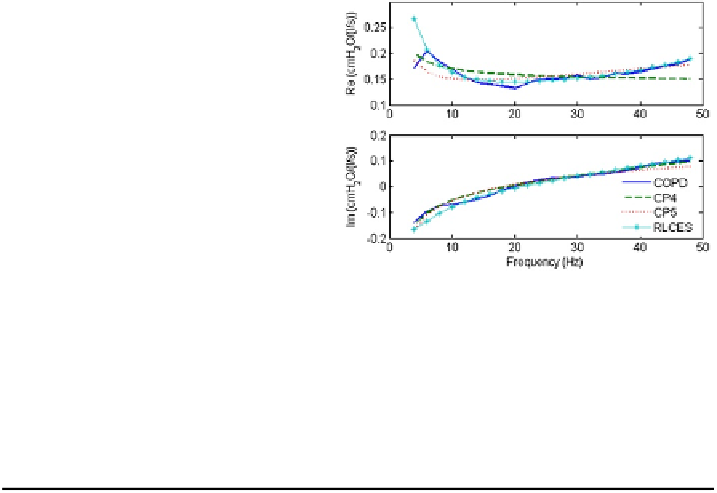
Fig. 3.9
The performance of
the RLCES model (
star line
),
the CP4 model (
dashed line
)
and the CP5 model (
dotted
line
), against measured data
(
continuous line
)inCOPD
patients
Ta b l e 3 . 2
Identified values for the
viscoelastic model
parameters and modeling errors. Ref.
Fig.
3.2
R
aw
C
s
R
ve
C
ve
E
R
E
X
E
T
Healthy
2.458
±
0.83
1.477e
+
9
0.117
±
0.012
2.04e
−
13
0.185
1.551
1.562
Asthma
1.925
±
0.61
0.291
±
0.04
0.817
±
0.23
6.37e
−
12
0.423
1.580
1.636
COPD
0.160
±
0.03
0.390
±
0.07
4.892e
−
4
1.43e
−
11
0.017
1.636
1.636
is very high (910
.
5778 cmH
2
O/(l/s)). As reported in [
29
], in trying to minimize the
error by not having the real part of the impedance decrease too rapidly (with respect
to frequency),
R
p
will tend to have larger values. Diong et al. suggest that it is not
entirely reliable to use any individual value of the model parameter to discriminate
between pathologic and healthy cases. However, the authors point to the possibility
of using two-parameter combinations for discriminating between healthy volunteers
and diagnosed patients.
It is also worth noticing that the estimated values of the RLCES model param-
eters are close to the ones estimated in the Mead model, leading to the conclusion
that the absence of wall compliance does not affect significantly the total impedance
of the human respiratory system.
Generally, the values for the model parameters in the three subject groups were
significantly different, allowing a separation (necessary for screening or for diagno-
sis). The airway resistance in models Viscoelastic, DuBois, and RLCES were fairly
close to each other, indicating good correlation between the various models for this
specific parameter. The same is valid for the central resistance values in models
Mead and CP5.
As referring to the specific values in each case (healthy, asthma, and COPD), the
resistance indicated correctly the possible variations with pathology. As expected,
the viscoelastic resistance
R
ve
in Viscoelastic was significantly lower in COPD than
in Healthy and Asthma groups. The peripheral resistance
R
p
in models Mead, Ex-
tended and RLCES had similar order of magnitude in each group, but their val-
ues did not correlate. Since the highest values are reported by the Extended model,
which also has the least number of parameters of the above mentioned three model