Biomedical Engineering Reference
In-Depth Information
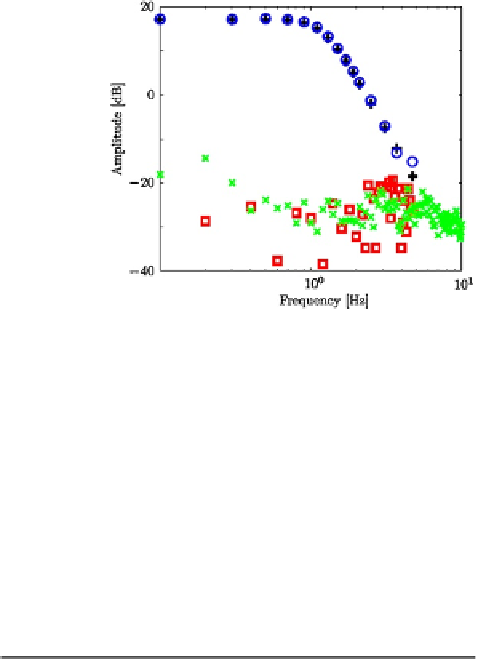
Fig. 9.11
Amplitude
spectrum of generated
pressure signals: the wanted
signal (
), generated pressure
on excited lines (
◦
), generated
pressure on the in-band
non-excited frequency lines
(
) and the sample
variance (x)
+
Ta b l e 9 . 1
Biometric parameters of the investigated healthy subjects. Values are given as mean
with standard deviations
14-years (20)
17-years (158)
Adults (20)
Elders (5)
Male/female
1/19
96/61
8/12
3/2
Age (yrs)
14
±
0
.
3
17
±
0
.
6
30
±
6
.
3
54
±
1
.
4
Height (m)
1
.
63
±
0
.
05
1
.
74
±
0
.
08
1
.
73
±
0
.
08
1
.
74
±
0
.
04
±
±
±
±
Weight (kg)
48
8
62
9
68
9
75
10
BMI
18
±
2
20
±
2
22
±
3
24
±
3
Smoking
0
9
3
2
Ta b l e 9 . 2
Biometric and
spirometric parameters of the
investigated diagnosed
subjects. Values are given as
mean with standard
deviations
Asthma (9)
COPD (13)
Female/male
6/3
4/9
Age (yrs)
52
±
14
66
±
12
Height (m)
1.68
±
0.05
1.67
±
0.04
Weight (kg)
70
±
11
80
±
13
BMI
25
±
5
28
±
4
FEV1 % pred
67
±
18
46
±
8
Ta b l e 9 . 3
Biometric and
spirometric parameters of the
investigated COPD subjects
divided according to GOLD
classification. Values are
given as mean with standard
deviations
GOLD II (5)
GOLD III (6)
GOLD IV (2)
Male/female
3/2
5/1
2/0
Age (yrs)
58
±
12
65
±
8
68
±
6
Height (m)
1.74
±
0.08
1.73
±
0.08
1.74
±
0.04
Weight (kg)
62
±
9
68
±
9
75
±
10
BMI
25
±
2
28
±
3
29
±
3
FEV1 % pred
67
±
8
42
±
6
27
±
4