Biomedical Engineering Reference
In-Depth Information
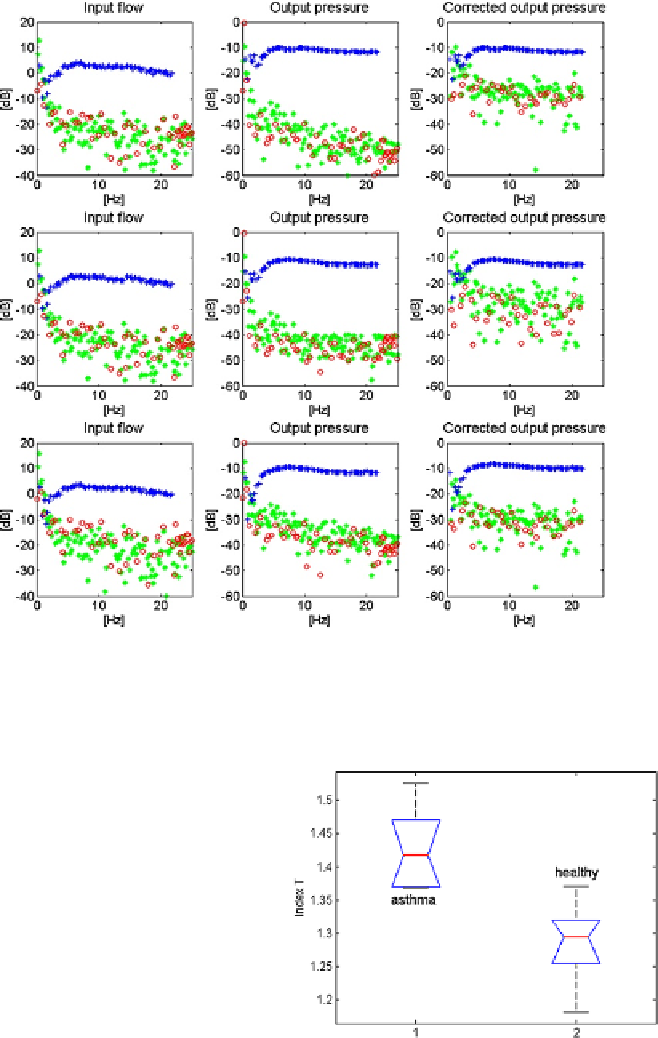
Fig. 9.8
Input (
left column
), output (
middle column
) and corrected DFT spectrum for non-linear
contributions (
right column
)ofa
cystic fibrosis
(
top row
),
asthma
(
middle row
)anda
healthy
volunteer (
bottom row
).
Blue '+'
: excited odd harmonics;
red 'o'
: non-excited odd harmonics;
green '*'
: non-excited even harmonics
Fig. 9.9
The boxplot of the
two groups of volunteers;
significant difference is
observed (
p<
0
.
0107)
interference with the breathing of the patient. The challenge is that the amplitude
and frequency of the breathing signal may vary within the measurement and from
one measurement to another, making the detection lines prone to biased values. The